May 1, 2024
Dr. Judah Cohen from Atmospheric and Environmental Research (AER) embarked on an experimental process of regular research, review, and analysis of the Arctic Oscillation (AO) and Polar Vortex (PV). This analysis is intended to provide researchers and practitioners real-time insights on one of North America’s and Europe’s leading drivers for extreme and persistent temperature patterns.
During the winter schedule the blog is updated once every week. Snow accumulation forecasts replace precipitation forecasts. Also, there is renewed emphasis on ice and snow boundary conditions and their influence on hemispheric weather. In late Spring, we transition to a spring/summer schedule, which is once every two weeks. Snow accumulation forecasts will be replaced by precipitation forecasts. Also, there will be less emphasis on ice and snow boundary conditions and their influence on hemispheric weather
Subscribe to our email list or follow me on Twitter (@judah47) for notification of updates.
The AO/PV blog is partially supported by NSF grant AGS: 1657748.
Summary
- The Arctic Oscillation (AO) is currently negative and is predicted to trend positive to neutral later this week as pressure/geopotential height anomalies across the Arctic are currently mostly positive but then pressure/geopotential height anomalies across the Arctic turn more mixed. The North Atlantic Oscillation (NAO) is currently negative with mostly positive pressure/geopotential height anomalies across Greenland and the NAO is predicted to trend neutral the next two weeks as pressure/geopotential height anomalies turn more mixed across Greenland.
- Weakening ridging/positive geopotential height anomalies across Greenland the next two weeks will support strengthening ridging/positive geopotential height anomalies across Western Europe with deepening troughing/negative geopotential height anomalies across Eastern Europe the next two weeks. This pattern will support normal to above normal temperatures across Western Europe including the United Kingdom (UK) with normal to below normal temperatures spreading across Eastern Europe the next two weeks.
- The general predicted pattern across Asia the next two weeks is troughing/negative geopotential height anomalies across Western Asia with ridging/positive geopotential height anomalies dominating Central and Eastern Asia. This pattern favors widespread normal to above normal temperatures across much of Central and Eastern Asia with normal to below normal temperatures Western Asia but focused on Western Russia the next two weeks.
- The predicted pattern general pattern across North America the next two weeks is troughing/negative geopotential height anomalies across Alaska, Western Canada and the Western United States (US) forcing ridging/positive geopotential height anomalies across eastern North America. However, during mid-May, troughing/negative geopotential height anomalies will try to spread into the Eastern US. This pattern favors normal to below normal temperatures across Alaska, Western Canada and the Western US with normal to above normal temperatures across Eastern Canada and the Eastern US this week and into next week. However, mid-month, normal to below normal temperatures will slowly spread across the Eastern US.
- In the Impacts section I discuss the ongoing impacts to Northern Hemisphere (NH) weather from the large disruption of the polar vortex (PV) in early March and the Final Warming.
Plain Language Summary
Episodic influence from the large polar vortex (PV) disruption in early March is still ongoing but will end soon. Observed cooler temperatures in the Eastern US and especially Europe in late April is giving way to cooler temperatures in Western Russia and western North America (see Figure 3). I posit this is related to the nature of the Final Warming or the disintegration of the PV. Otherwise, the weather models are predicting an overall warm weather pattern across the Northern Hemisphere (NH; see Figure 13). But I do wonder if the PV (or lack thereof) has at least one more trick up its sleeve that could result in unexpected cooler weather.
Impacts
Maybe like a crack addict, I can’t just quite the polar vortex but I still see the coupling between the polar vortex and our weather as the most interesting interaction to discuss in this week’s blog.
The polar vortex (PV) has exited the stage for the remainder of the spring and summer as defined by the Final Warming (where the zonal mean zonal wind at 60°N and 10hPa stays easterly or below zero until the sun begins to set over the North Pole in late summer), which occurred over the weekend. Yet the impacts from the large polar vortex (PV) disruption/sudden stratospheric warming (SSW), from early March are still influencing the weather. Strong high latitude blocking in the North Atlantic and an impressively negative AO/NAO brought the return of cooler and wetter (and even white) weather to Europe for much of April. It also brought some cooler weather to the Eastern US for the latter half of the month.
Looking at the polar cap geopotential height anomalies (PCHs) (Figure 11) appears undecisive or uncommitted if the infleunce will finally come to an end this week. To me looks like it could go either way. There is also the Final Warming that has occurred. Not my expertise but doesn’t really look like a dynamic Final Warming and therefore we should not expect a direct influence on our weather from the Final Warming. However, it makes sense to me that the Final Warming could still be supportive of wave reflection that results in high latitude blocking.
Even though that technically the PV may be considered gone for the season, I would argue that it is still having an influence. Though it is clear that the PV low center has vacated the North Pole replaced by high pressure in the polar stratosphere, there is still a remnant predicted this week centered over Western Asia near the Urals (see Figure i). We observed in April below normal temperatures in both eastern North America and Europe at the end of April related to episodic downward influence from the early March SSW and Greenland blocking but the models are now focusing the below normal temperatures in Western Russia related to troughing in the region this week (see Figures 2 and 3). Often during the winter, when the PV center migrated off the Pole, I discuss a tropospheric reflection of the displaced PV center resulting in cold weather in that region. This past winter we had examples of this phenomenon in Scandinavia. So even though the PV has technically disappeared, the same phenomenon is still occurring this week, in my opinion.
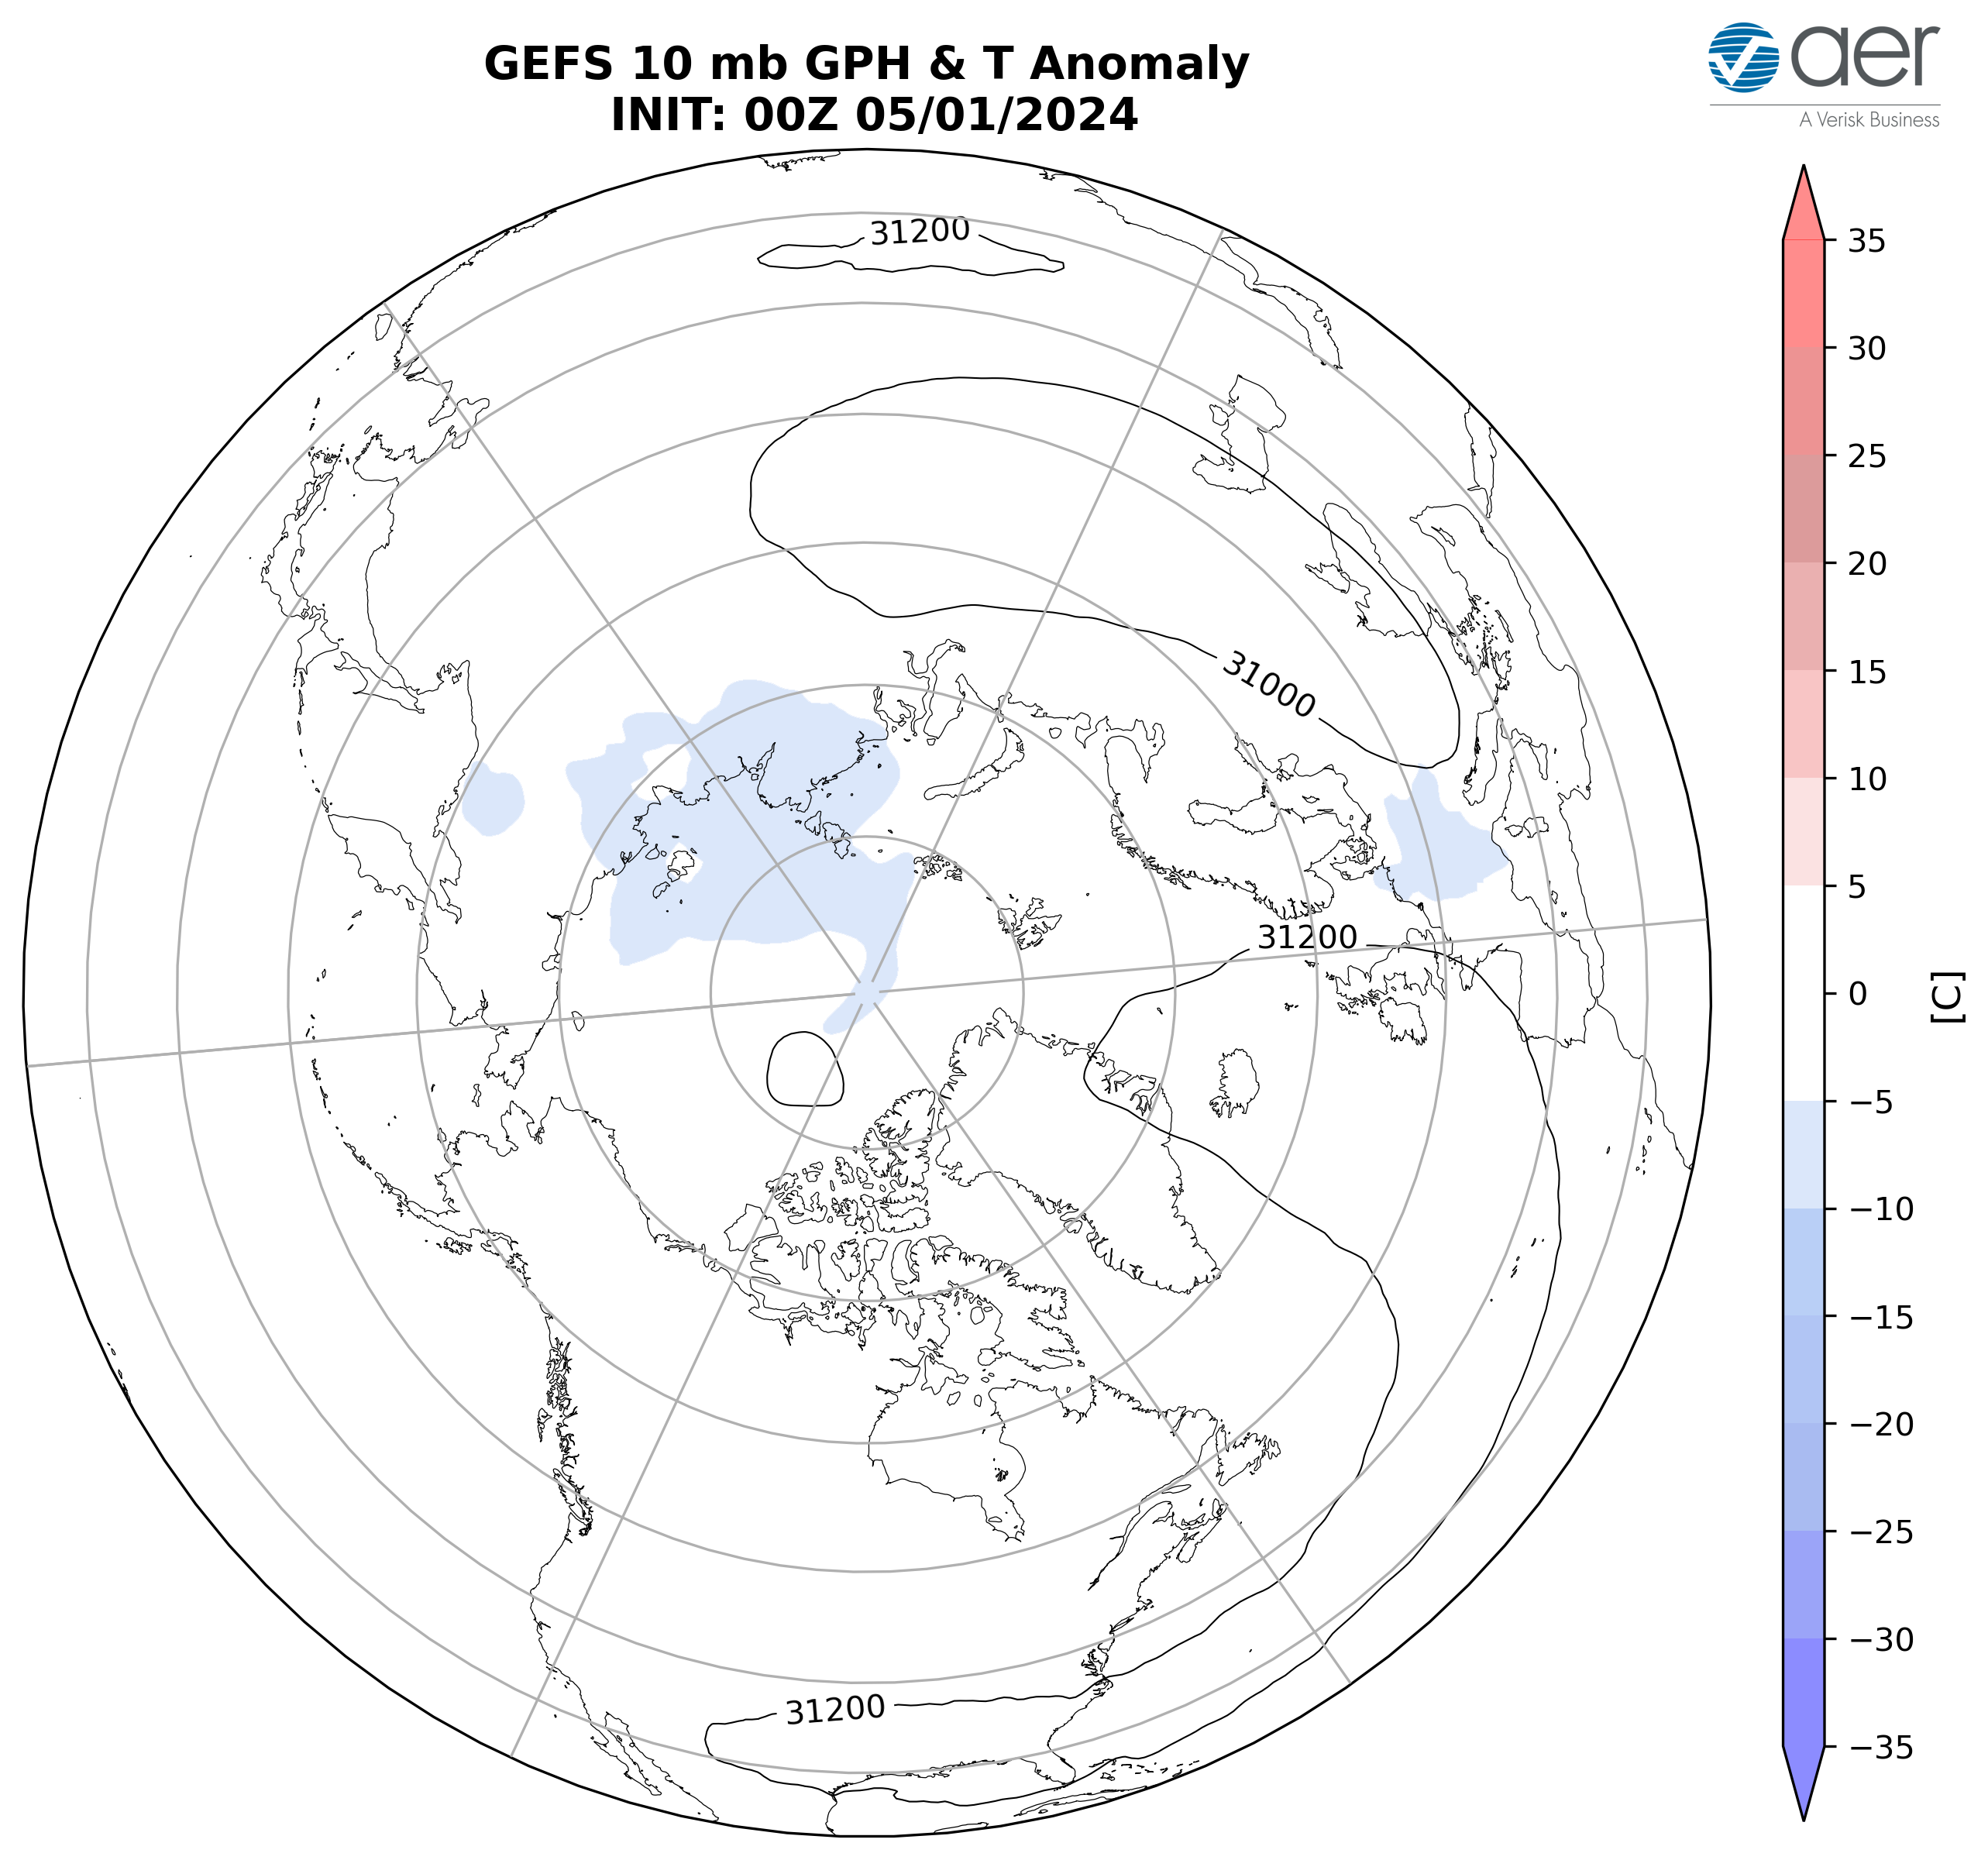
Figure i. Observed 10 mb geopotential heights (dam; contours) and temperature anomalies (°C; shading) across the Northern Hemisphere from 1 May 2024.
The summer mid-tropospheric circulation in recent years has been characterized by low-pressure troughing centered over the North Pole/Central Arctic with high-pressure ridging along centered in the mid- to high-latitude continents especially over western North America, the east coast of North America, Eastern Europe and East Asia coupled with widespread above normal temperatures across the continents with only regional below normal temperatures. From what I can tell the weather models are trying to transition into different variations of this pattern. However, as I discussed just above, I wonder if the Final Warming might support some wave reflection that would result in more high latitude high-pressure blocking than currently predicted by the models and therefore more widespread below normal temperatures at least in some regions of the NH continents like the Eastern US and/or Europe.
Near-Term
This week
The AO is predicted to be negative this week (Figure 1) with mostly positive geopotential height anomalies across the Arctic and with mixed geopotential height anomalies across the mid-latitudes of the NH (Figure 2). With predicted positive geopotential height anomalies across Greenland (Figure 2), the NAO is predicted to be negative this week as well.
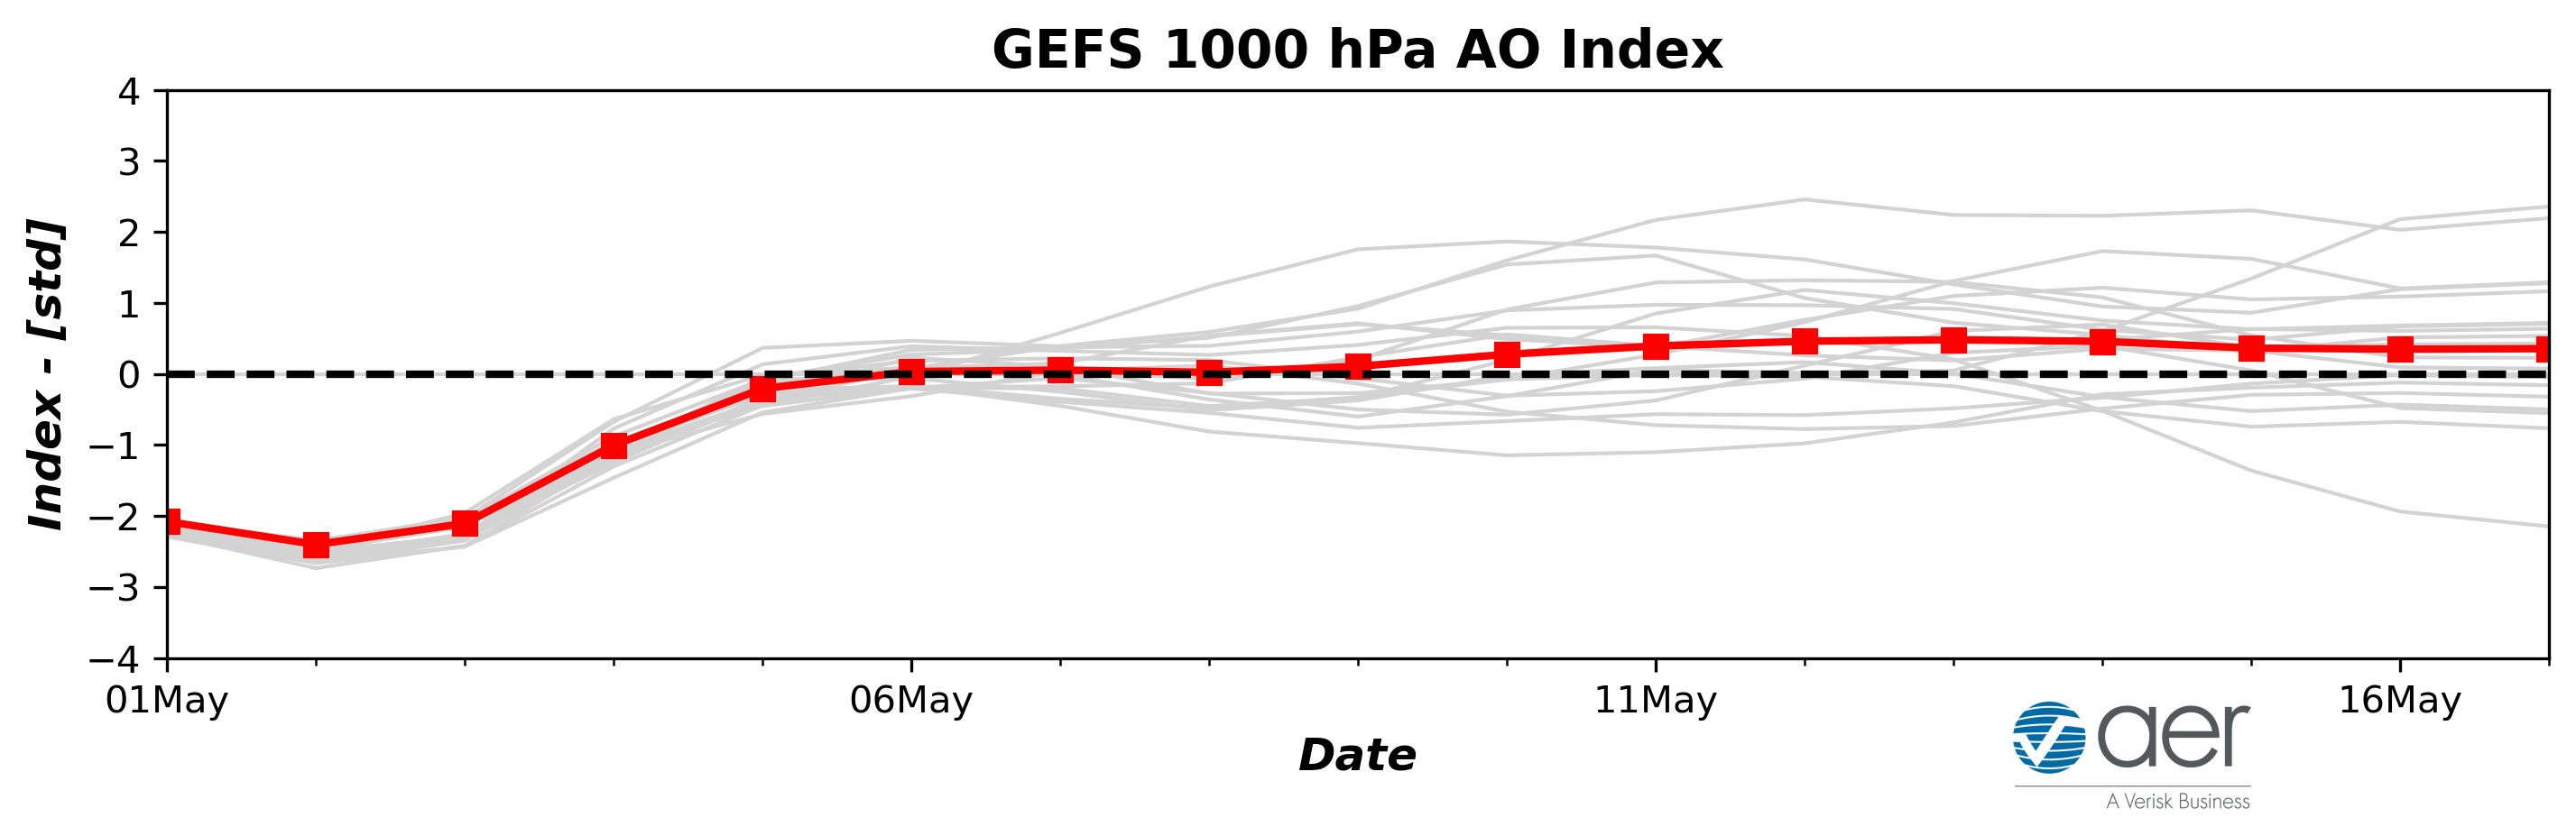
Figure 1. The predicted daily-mean AO at 1000 hPa from the 00Z 1 May 2024 2024 GFS ensemble. Gray lines indicate the AO index from each individual ensemble member, with the ensemble-mean AO index given by the red line with squares.
This week, weakening ridging/positive geopotential height anomalies across Greenland will allow recent troughing/negative geopotential height anomalies across much of Europe to dissipate with ridging/positive geopotential height anomalies spreading across Europe (Figures 2). This pattern favors normal to above normal temperatures across most of Europe including the UK with normal to below normal temperatures lingering across parts of Western Europe (Figure 3). This week ridging/positive geopotential height anomalies are predicted to dominate much of Asia with the exceptions of deep troughing/negative geopotential height anomalies across Western Asia and weaker troughing in China (Figure 2). This pattern favors widespread normal to above normal temperatures across much of Asia with normal to below normal temperatures limited to Western Russia and much of China (Figure 3).
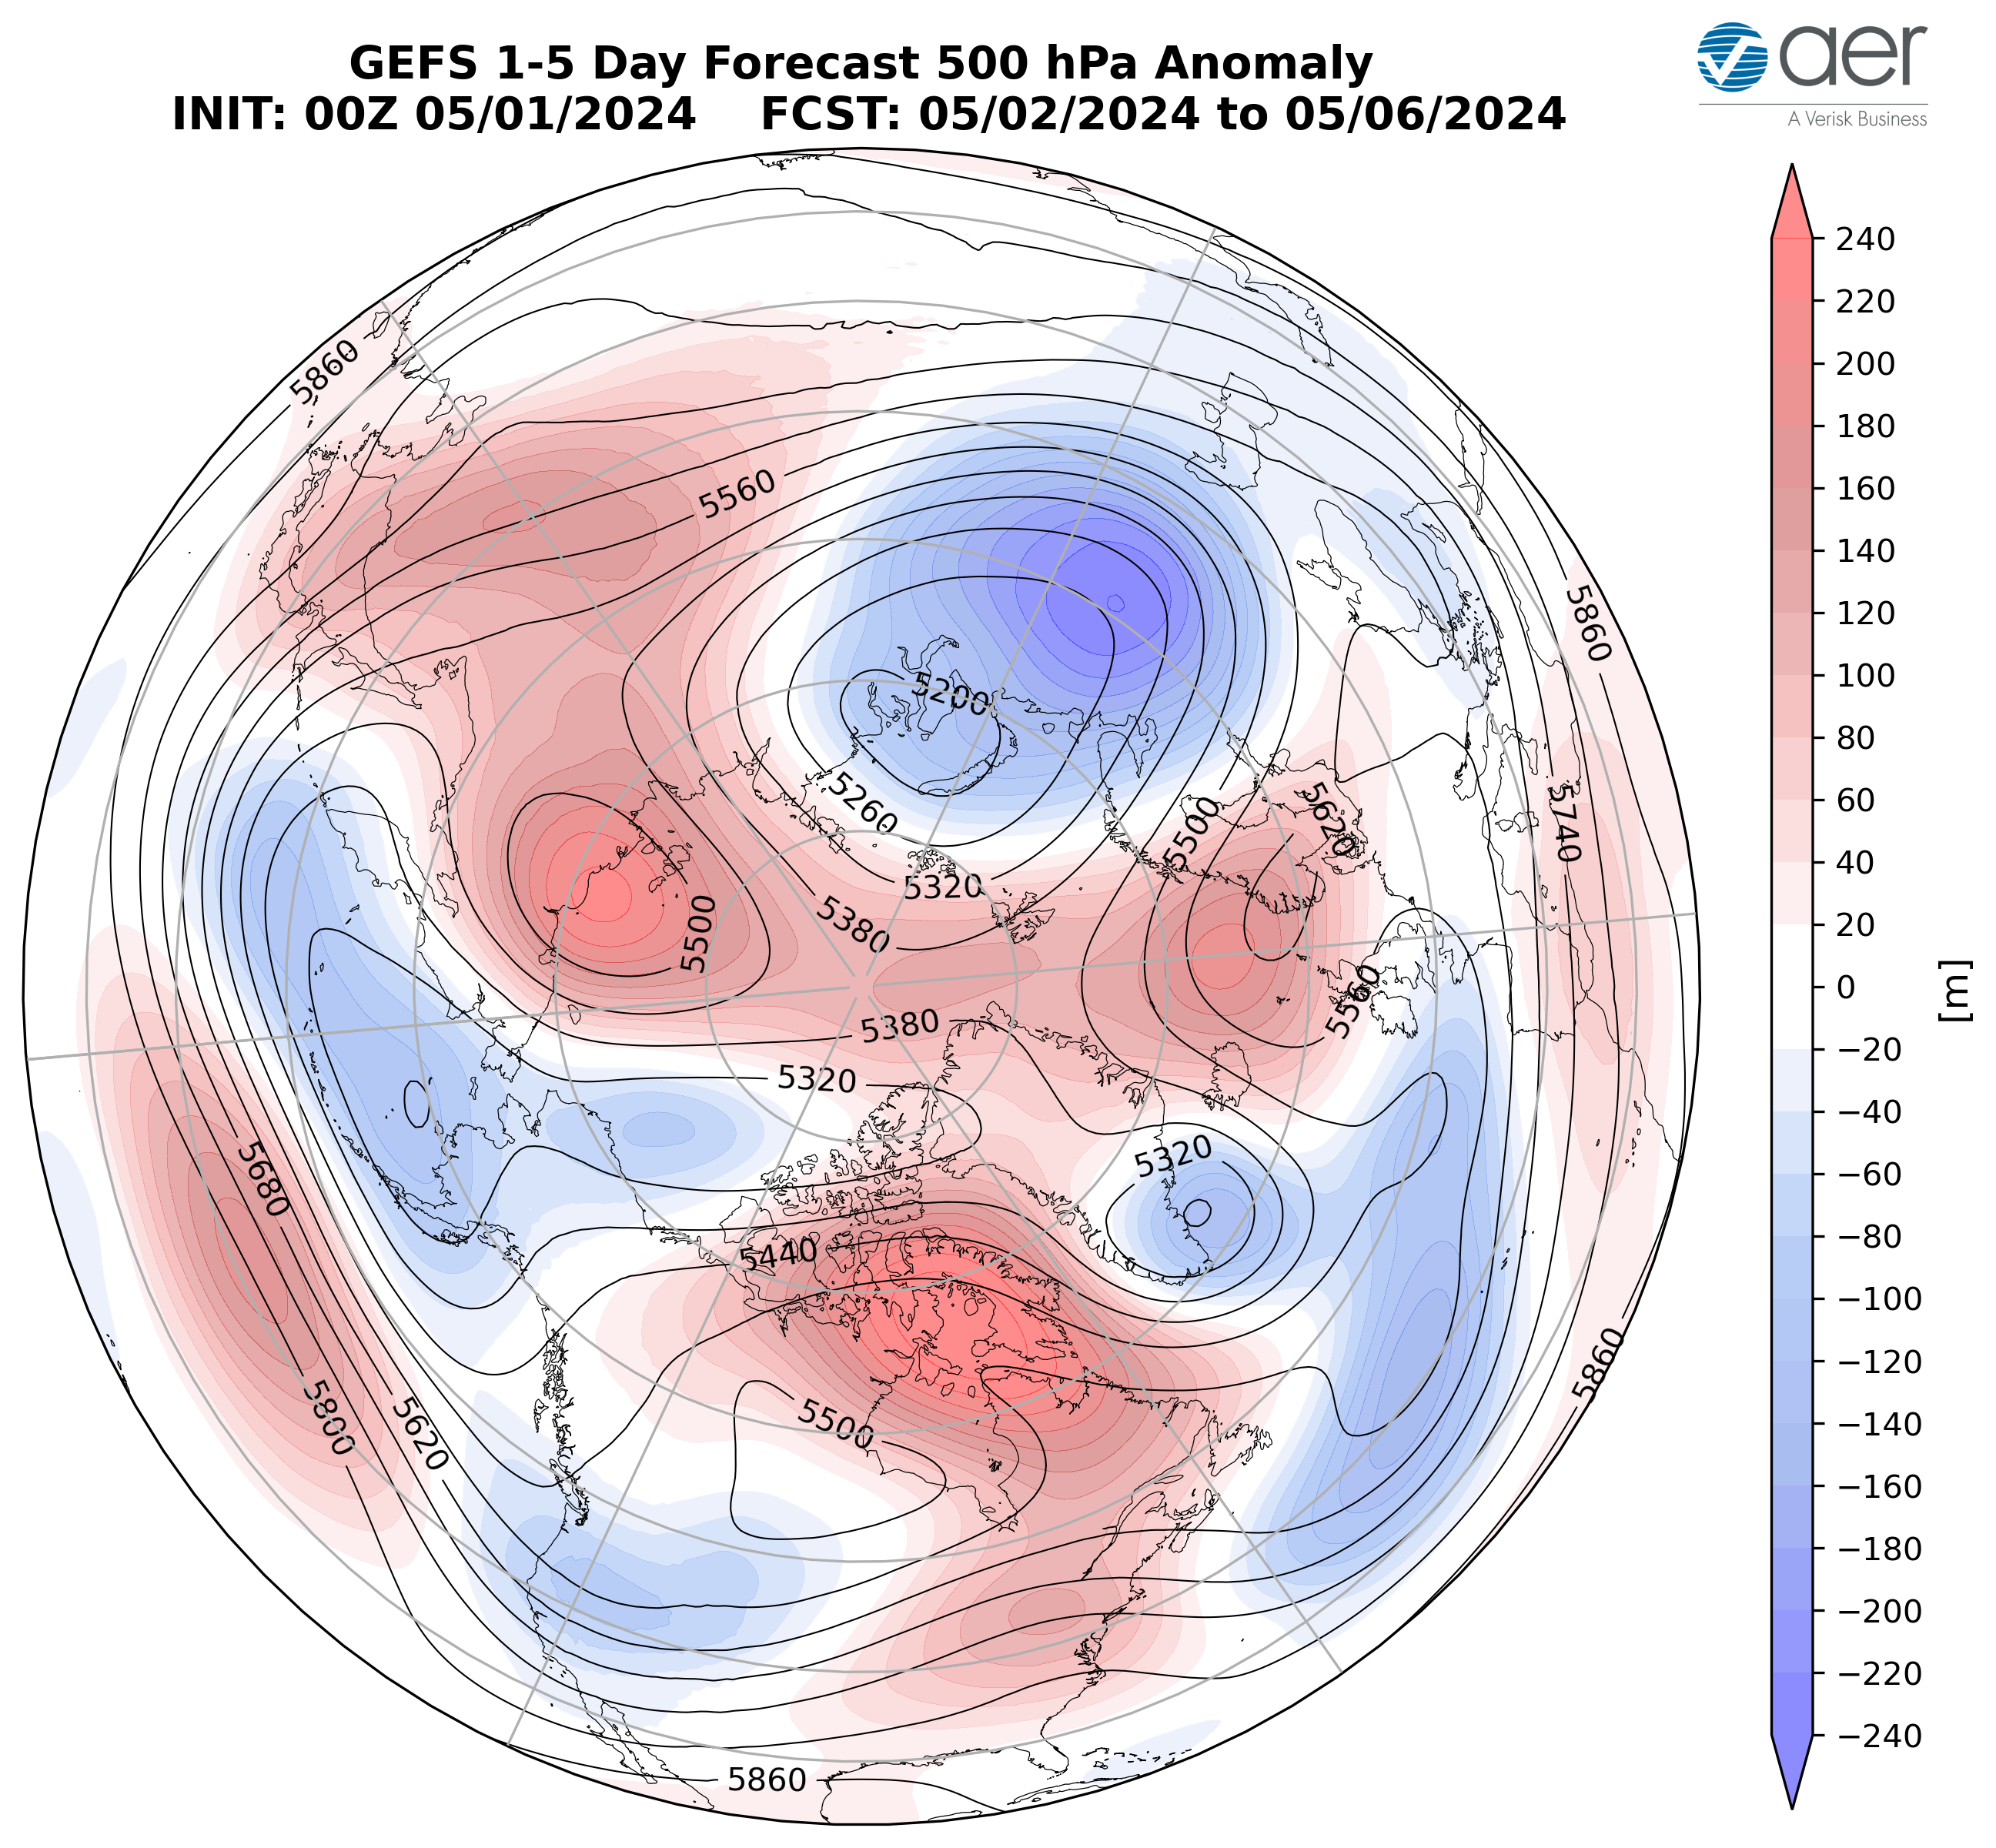
Figure 2. Forecasted average 500 mb geopotential heights (dam; contours) and geopotential height anomalies (m; shading) across the Northern Hemisphere from 2 – 6 May 2024. The forecasts are from the 00z 1 May 2024 2024 GFS ensemble.
The pattern this week across North America is troughing/negative geopotential height anomalies across Alaska and western North America forcing ridging/positive geopotential height anomalies across Eastern Canada and the Eastern US (Figure 2). This pattern will favor normal to below normal temperatures across Alaska, Western Canada and the Western US with normal to above normal temperatures across Eastern Canada and the Eastern US (Figure 3).
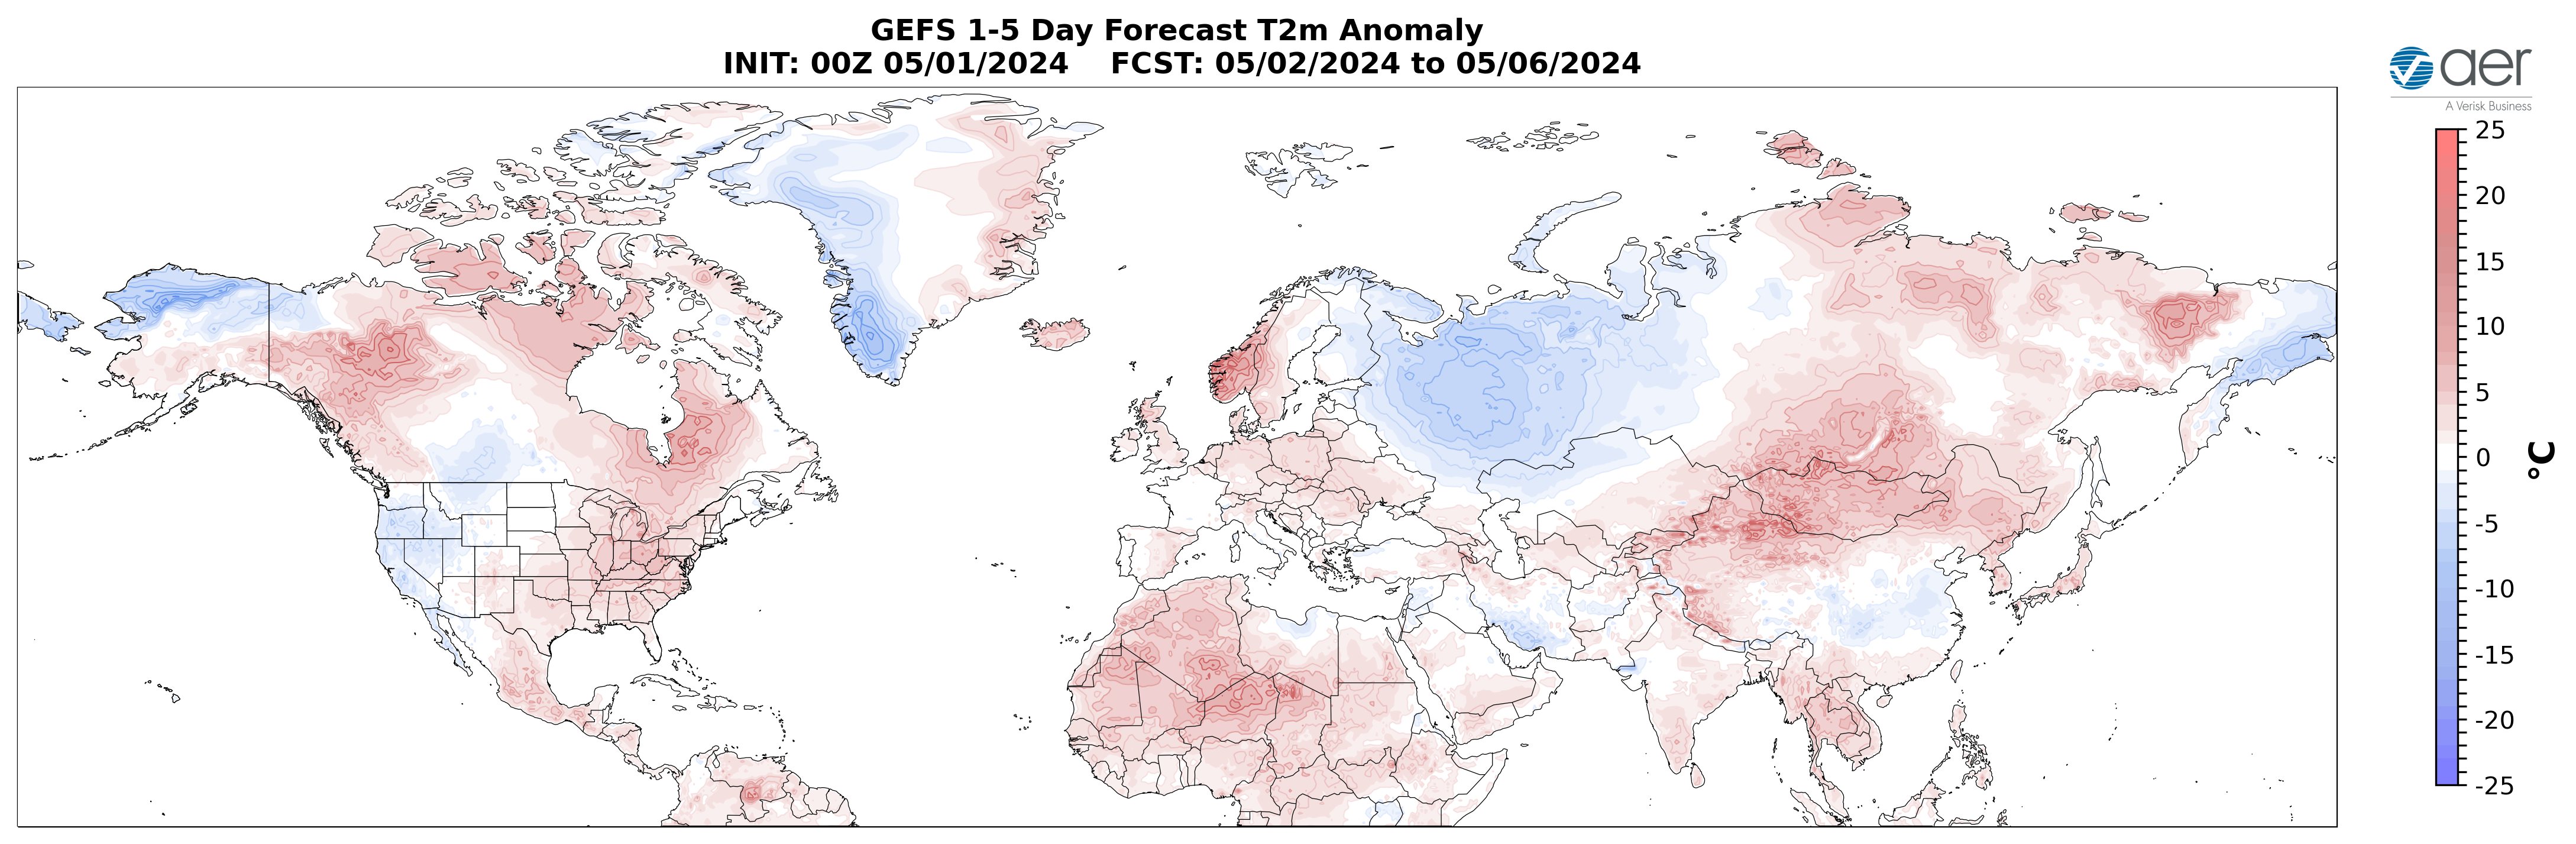
Figure 3. Forecasted surface temperature anomalies (°C; shading) from 2 – 6 May 2024. The forecast is from the 00Z 1 May 2024 2024 GFS ensemble.
Troughing will support above normal rainfall across the parts of Western and Southern Europe and Southeast Asia with normal to below normal rainfall elsewhere across Eurasia this week (Figure 4). Troughing will support above normal rainfall across southern Alaska, the Western US and the US Plains with normal to below normal rainfall across the interior of North America and the US East Coast this week (Figure 4).
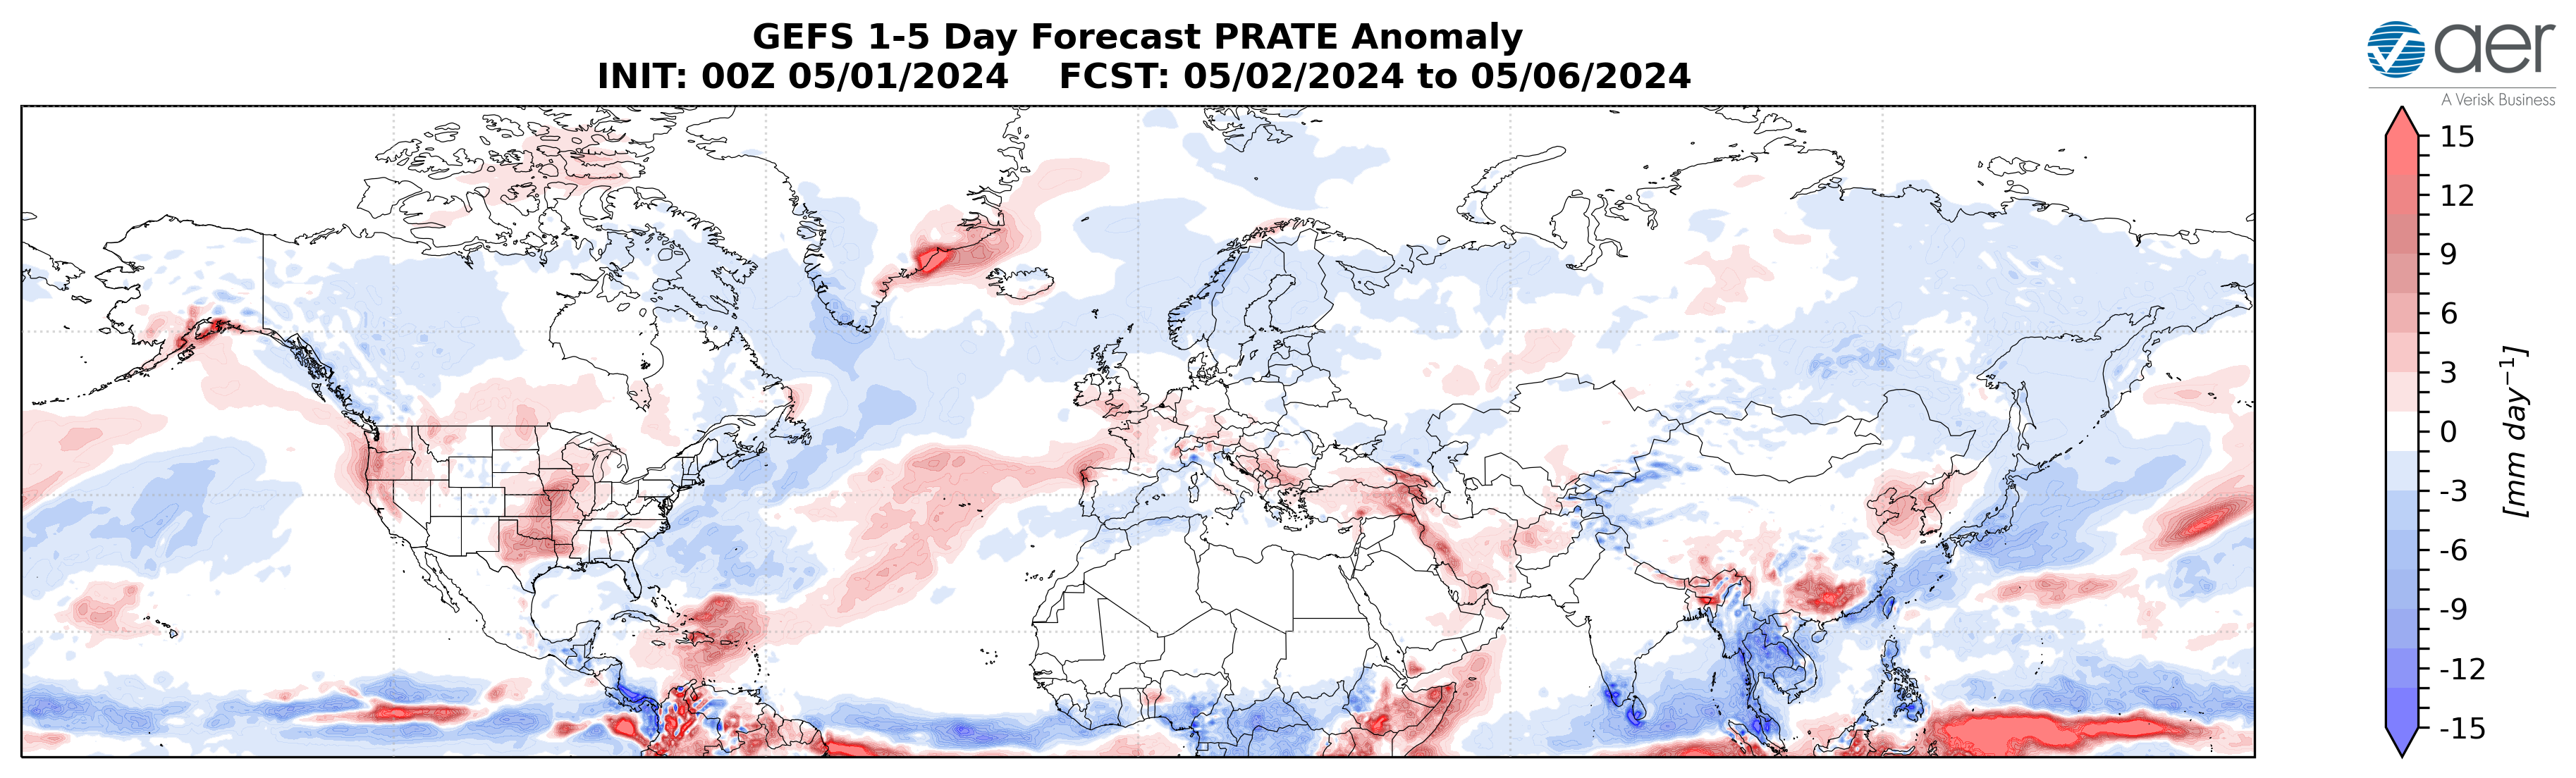
Figure 4. Forecasted precipitation anomalies (mm/day; shading) from 2 – 6 May 2024. The forecast is from the 00Z 1 May 2024 2024 GFS ensemble.
Near-Mid Term
Next week
With geopotential height anomalies turning more mixed across the Arctic and with mixed geopotential height anomalies across the mid-latitudes this period (Figure 5), the AO will likely remain close to neutral this period (Figure 1). With more mixed pressure/geopotential height anomalies across Greenland (Figure 5), the NAO will be neutral to slightly negative this period.
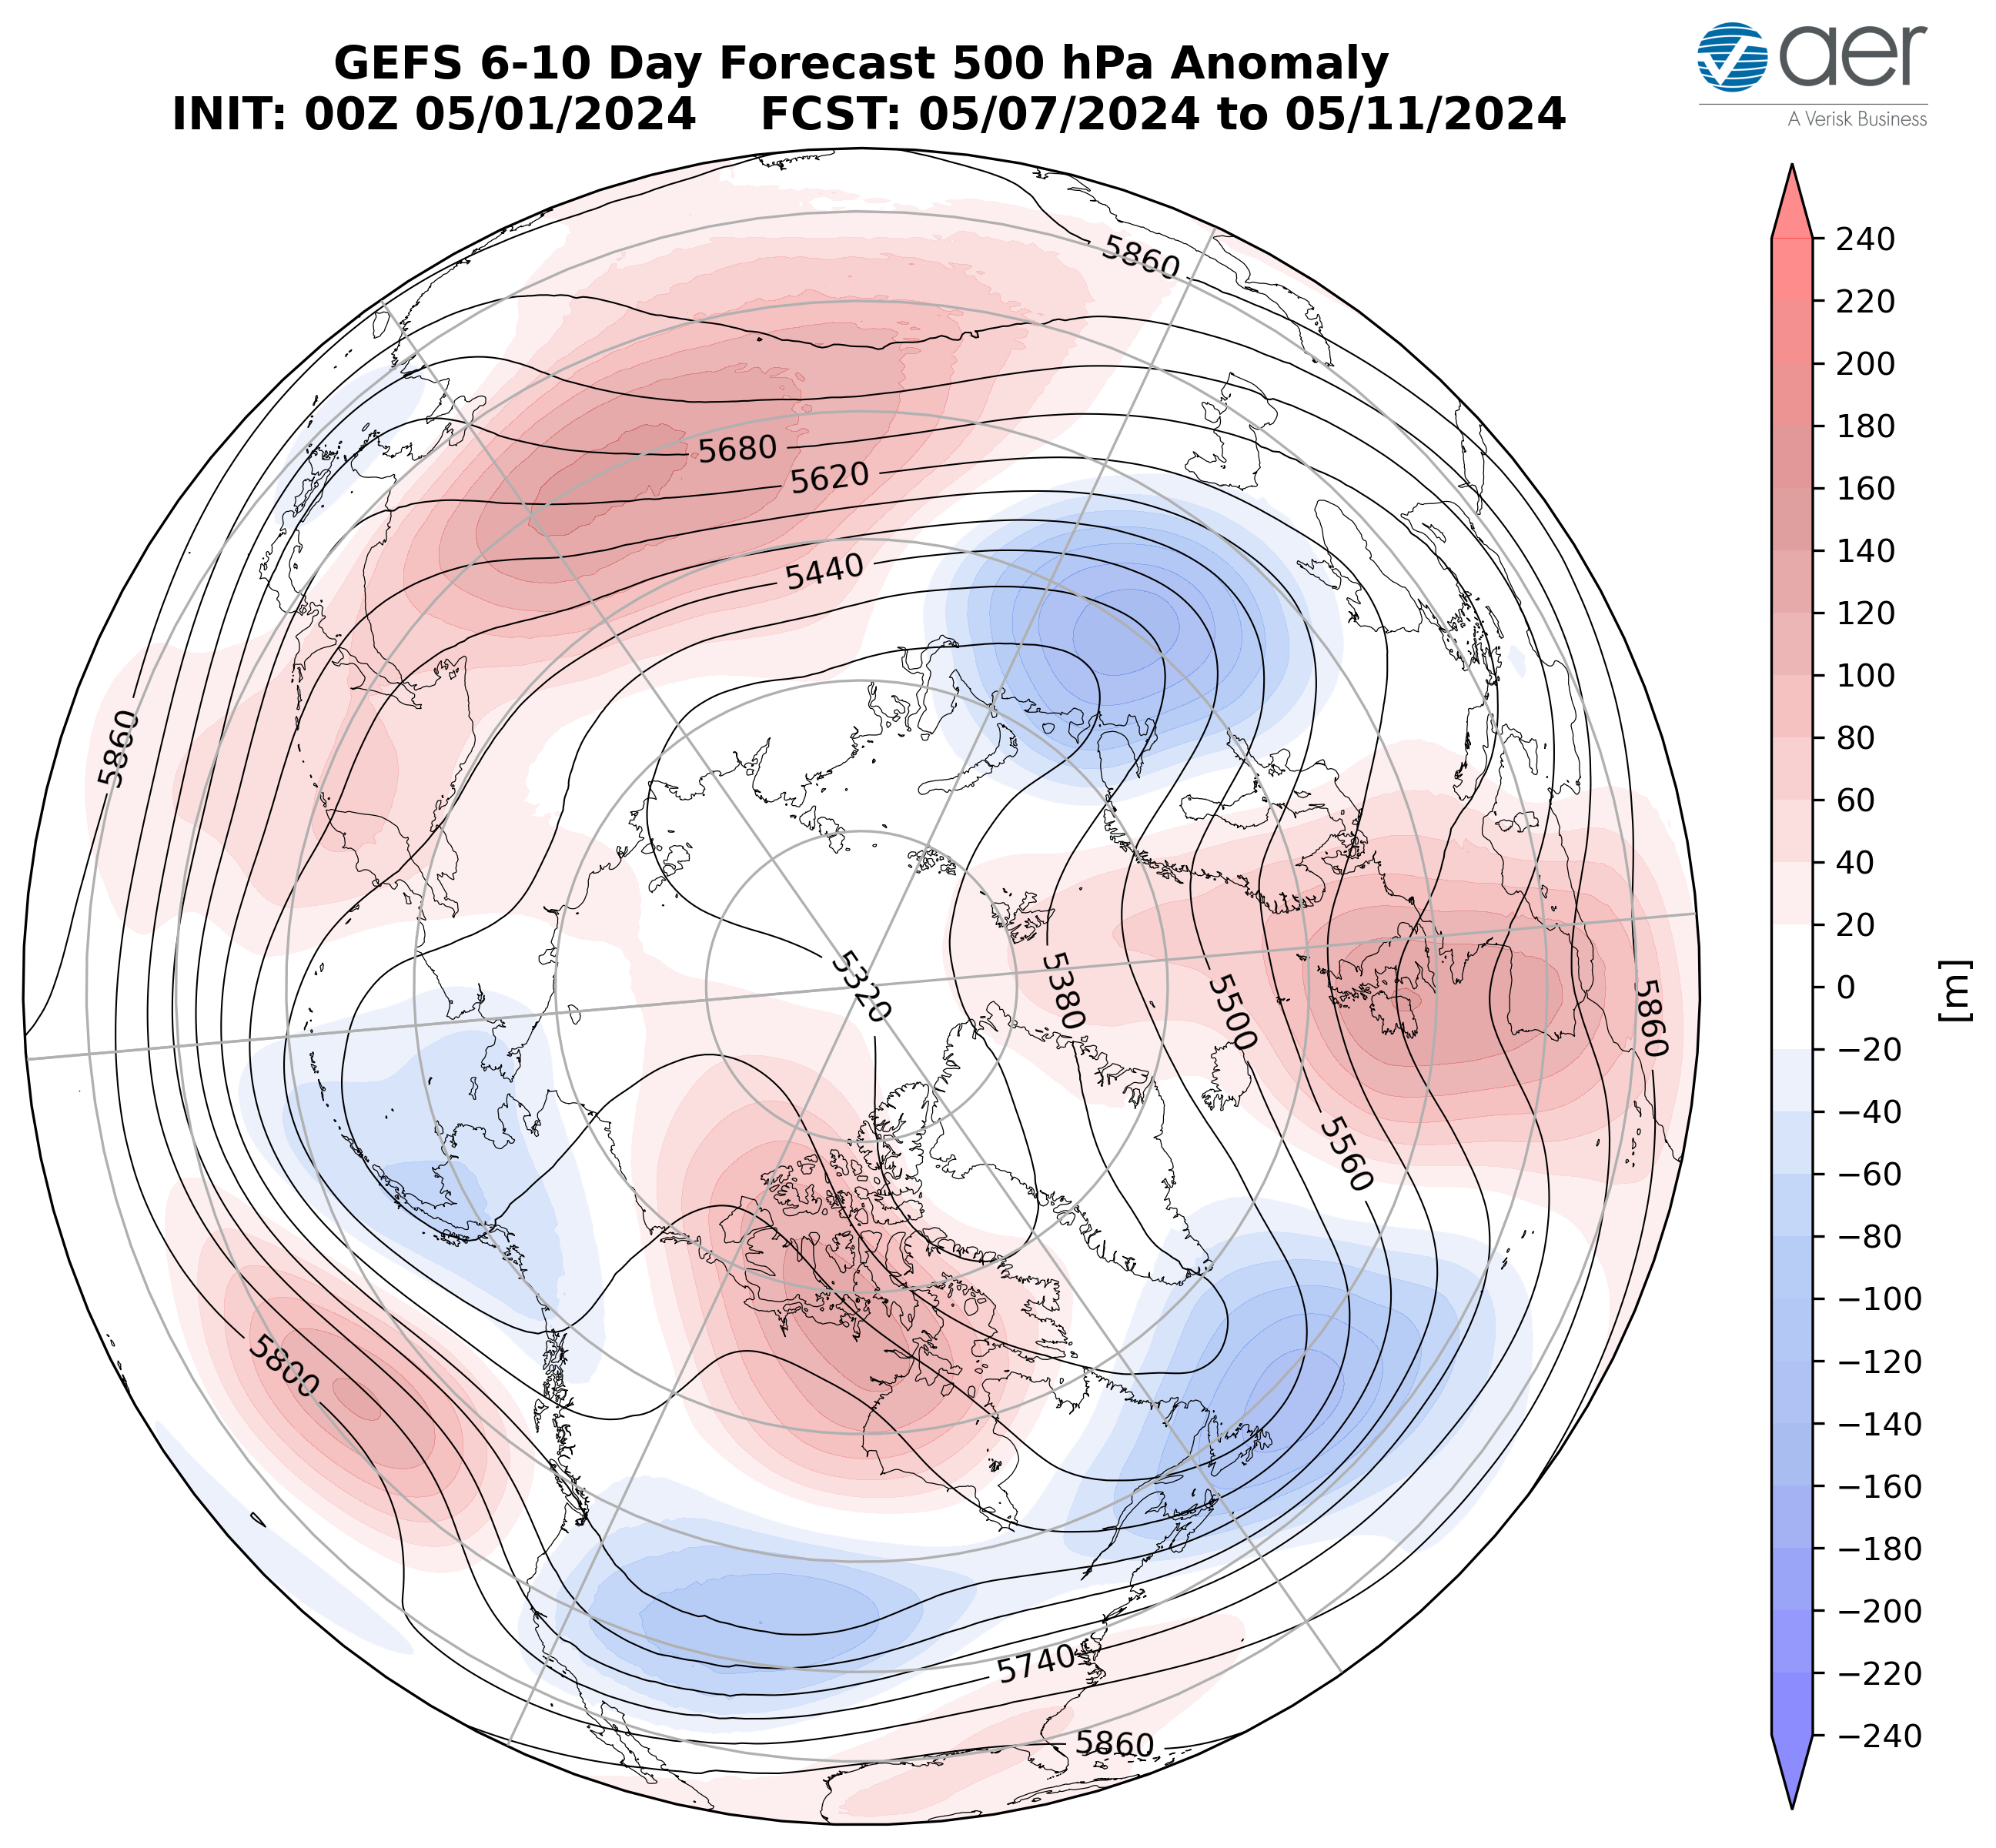
Figure 5. Forecasted average 500 mb geopotential heights (dam; contours) and geopotential height anomalies (m; shading) across the Northern Hemisphere from 7 – 11 May 2024. The forecasts are from the 00z 1 May 2024 2024 GFS ensemble.
Waning ridging/positive geopotential height anomalies across Greenland will support strengthening ridging/positive geopotential height anomalies across Western Europe forcing troughing/negative geopotential height anomalies across Eastern Europe this period (Figure 5). This pattern will favor normal to above normal temperatures across Western Europe including the UK with normal to below normal temperatures across Eastern Europe (Figures 6). Persistent troughing/negative geopotential height anomalies are predicted to dominate Western Asia with ridging/positive geopotential height anomalies across Central and Eastern Asia this period (Figure 5). This pattern favors widespread normal to above normal temperatures across much of Asia with the exception of normal to below normal temperatures limited to Western Russia west of the Urals this period (Figure 6).
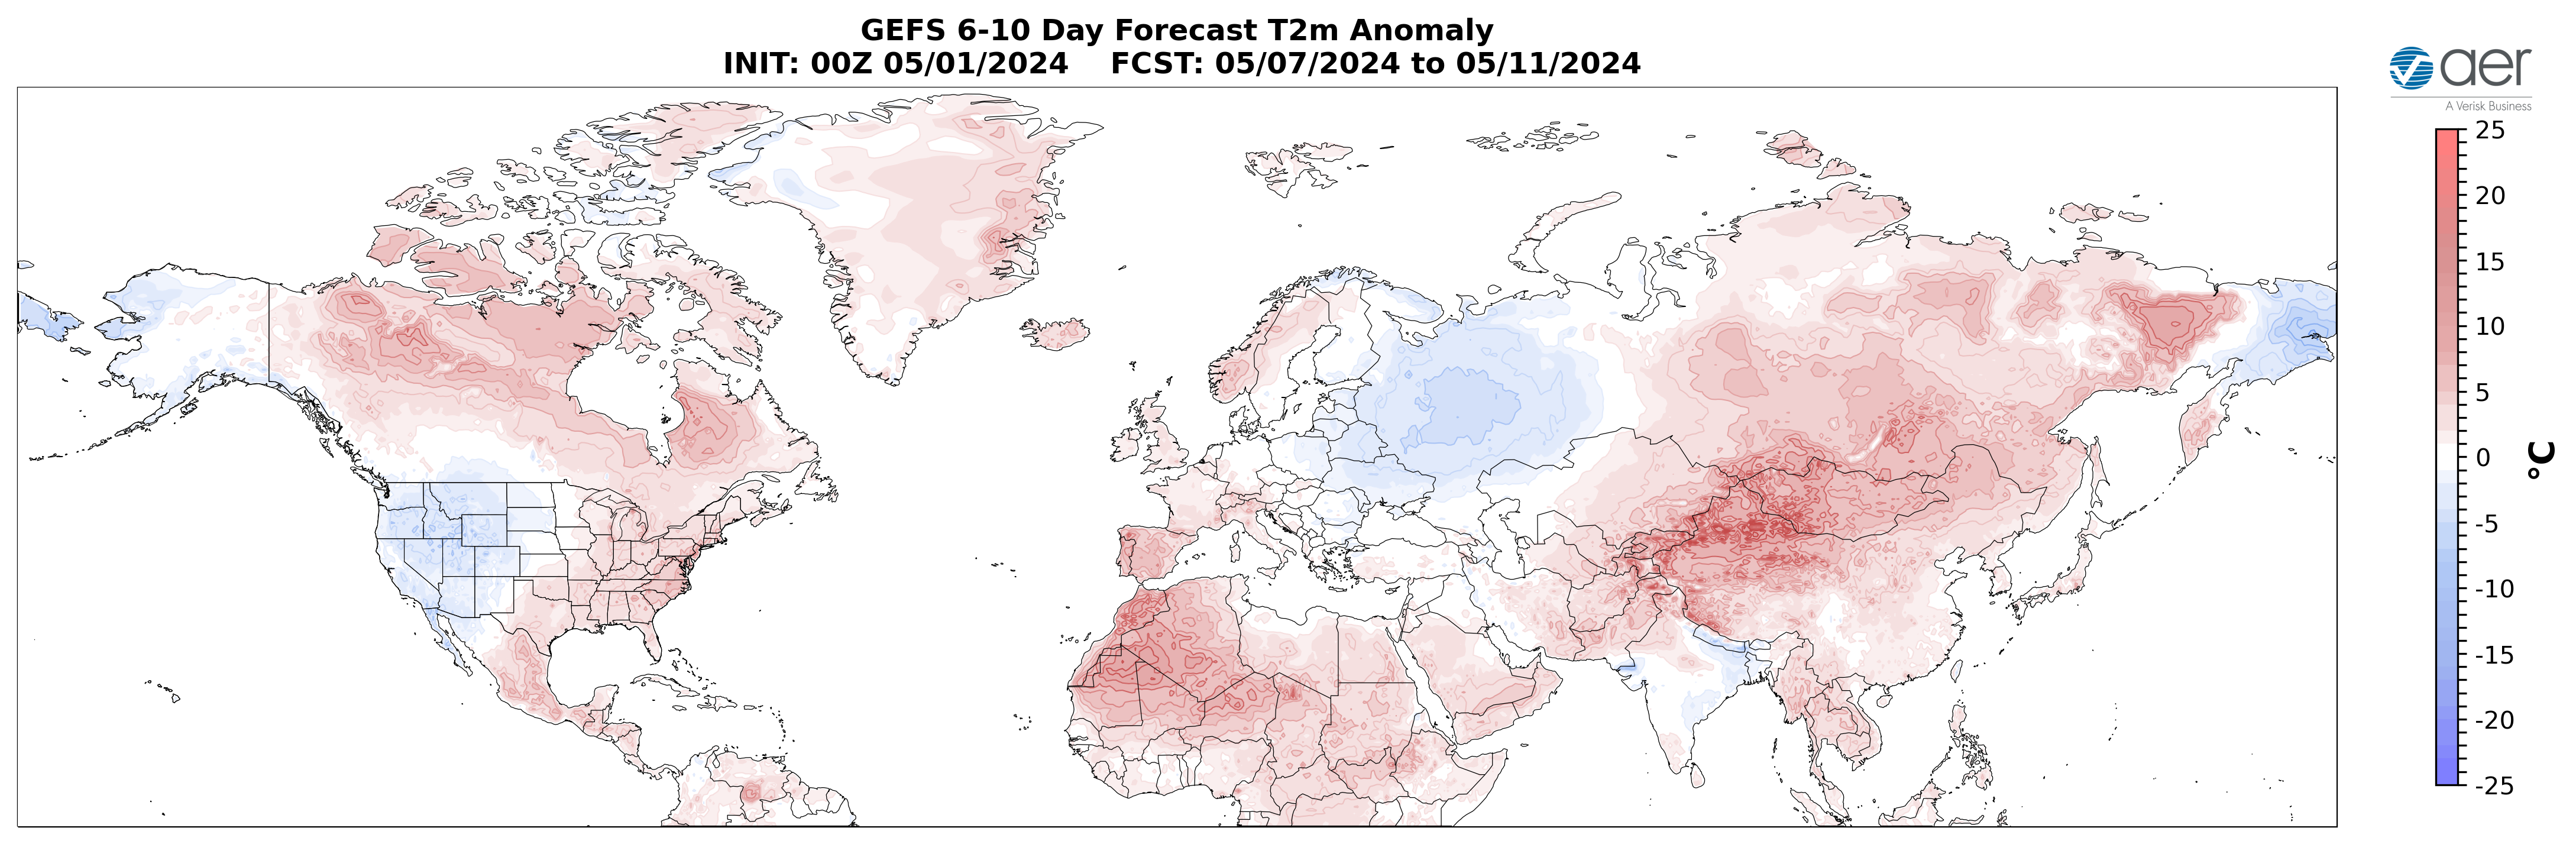
Figure 6. Forecasted surface temperature anomalies (°C; shading) from 7 – 11 May 2024. The forecasts are from the 00z 1 May 2024 2024 GFS ensemble.
Persistent troughing/negative geopotential height anomalies across Alaska, the West Coast of Canada and the Western US will continue to support ridging/positive geopotential height anomalies across Eastern Canada and the Eastern US this period (Figure 5). This pattern favors normal to below normal temperatures across Alaska, the West Coast of Canada and the Western US with normal to below normal temperatures across Eastern Canada and the Eastern US (Figure 6).
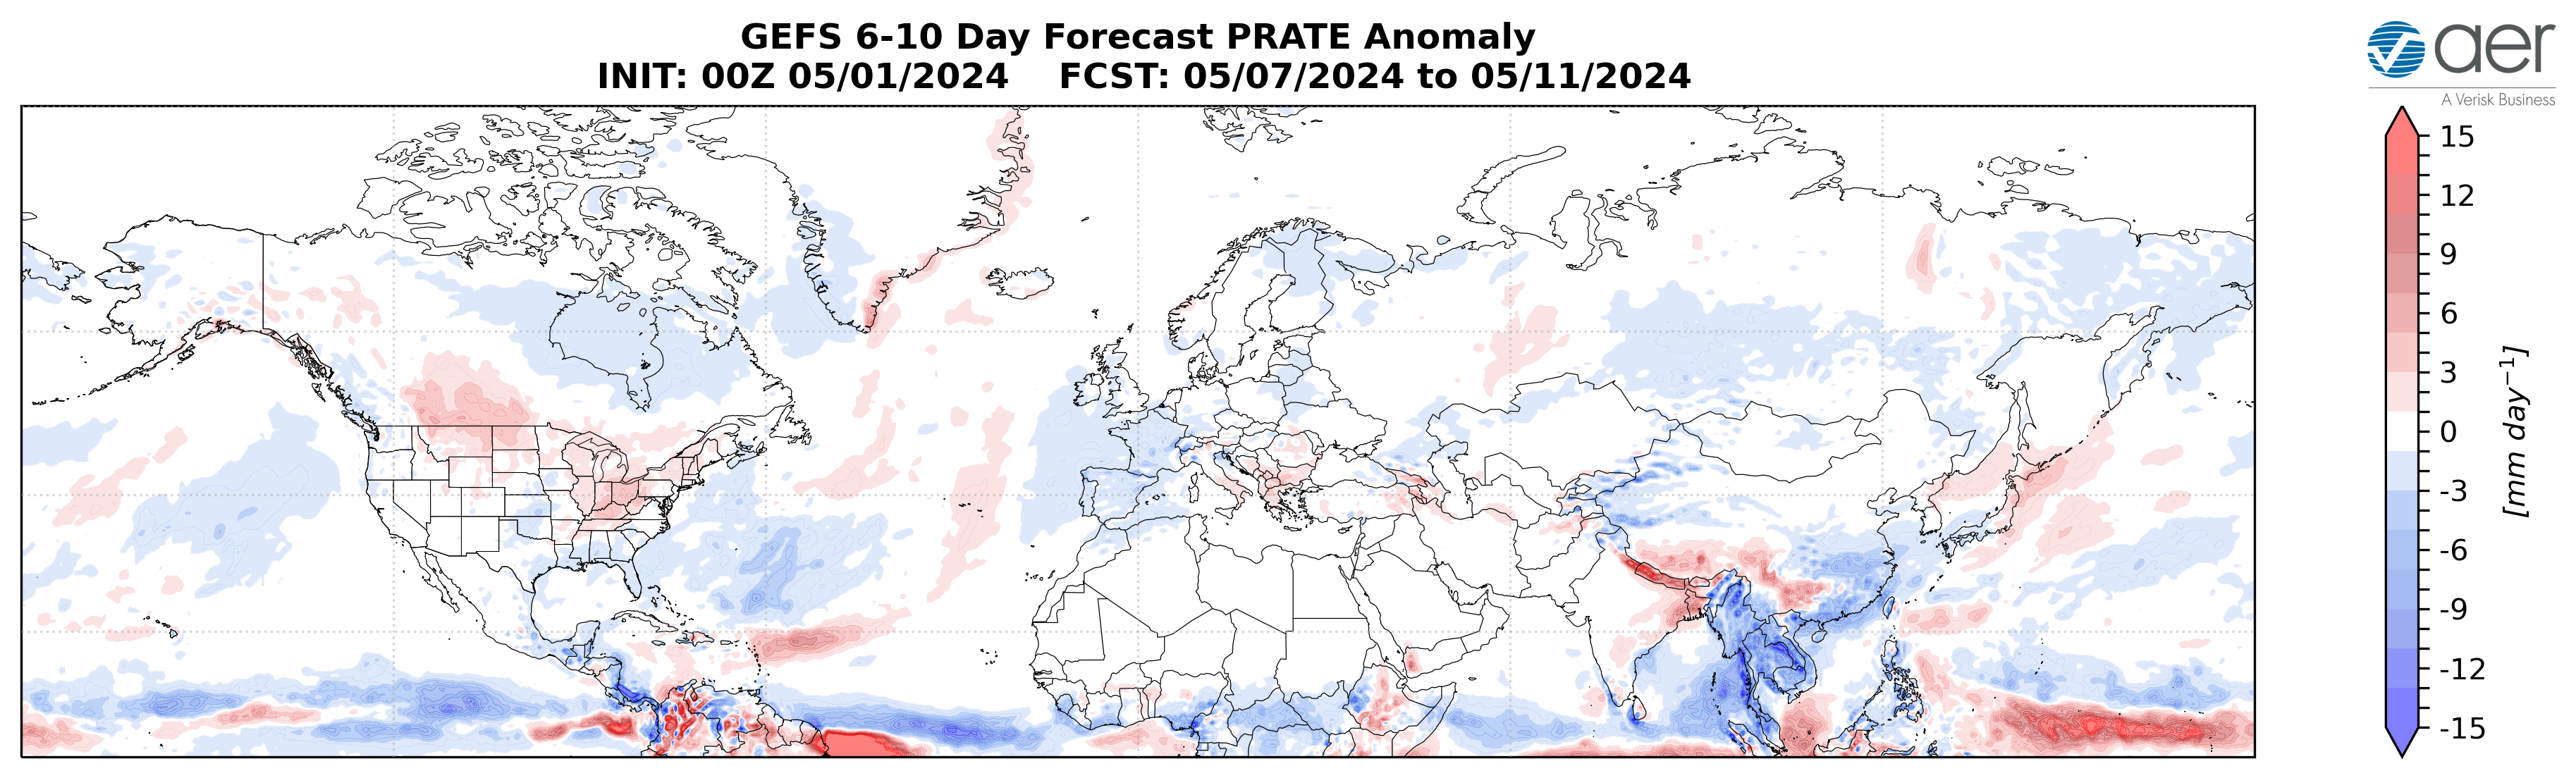
Figure 7. Forecasted precipitation anomalies (mm/day; shading) from 7 – 11 May 2024. The forecast is from the 00Z 1 May 2024 2024 GFS ensemble.
Troughing will support above normal rainfall across the Balkans, the Tibetan Plateau and parts of East Asia with normal to below normal rainfall elsewhere across Eurasia this period (Figure 7). Troughing will support above normal rainfall in the Plains of Canada and the Northern US, the Great Lakes, the Ohio Valley and the Northeastern US with normal to below normal rainfall across the rest of North America this period (Figure 7).
Mid Term
Week Two
With predicted mostly mixed to positive geopotential height anomalies across the Arctic and mixed geopotential height anomalies across the mid-latitudes this period (Figure 8), the AO will likely be close to neutral this period (Figure 1). With weak and mixed pressure/geopotential height anomalies across Greenland (Figure 8), the NAO should be also close to neutral to weakly negative this period.
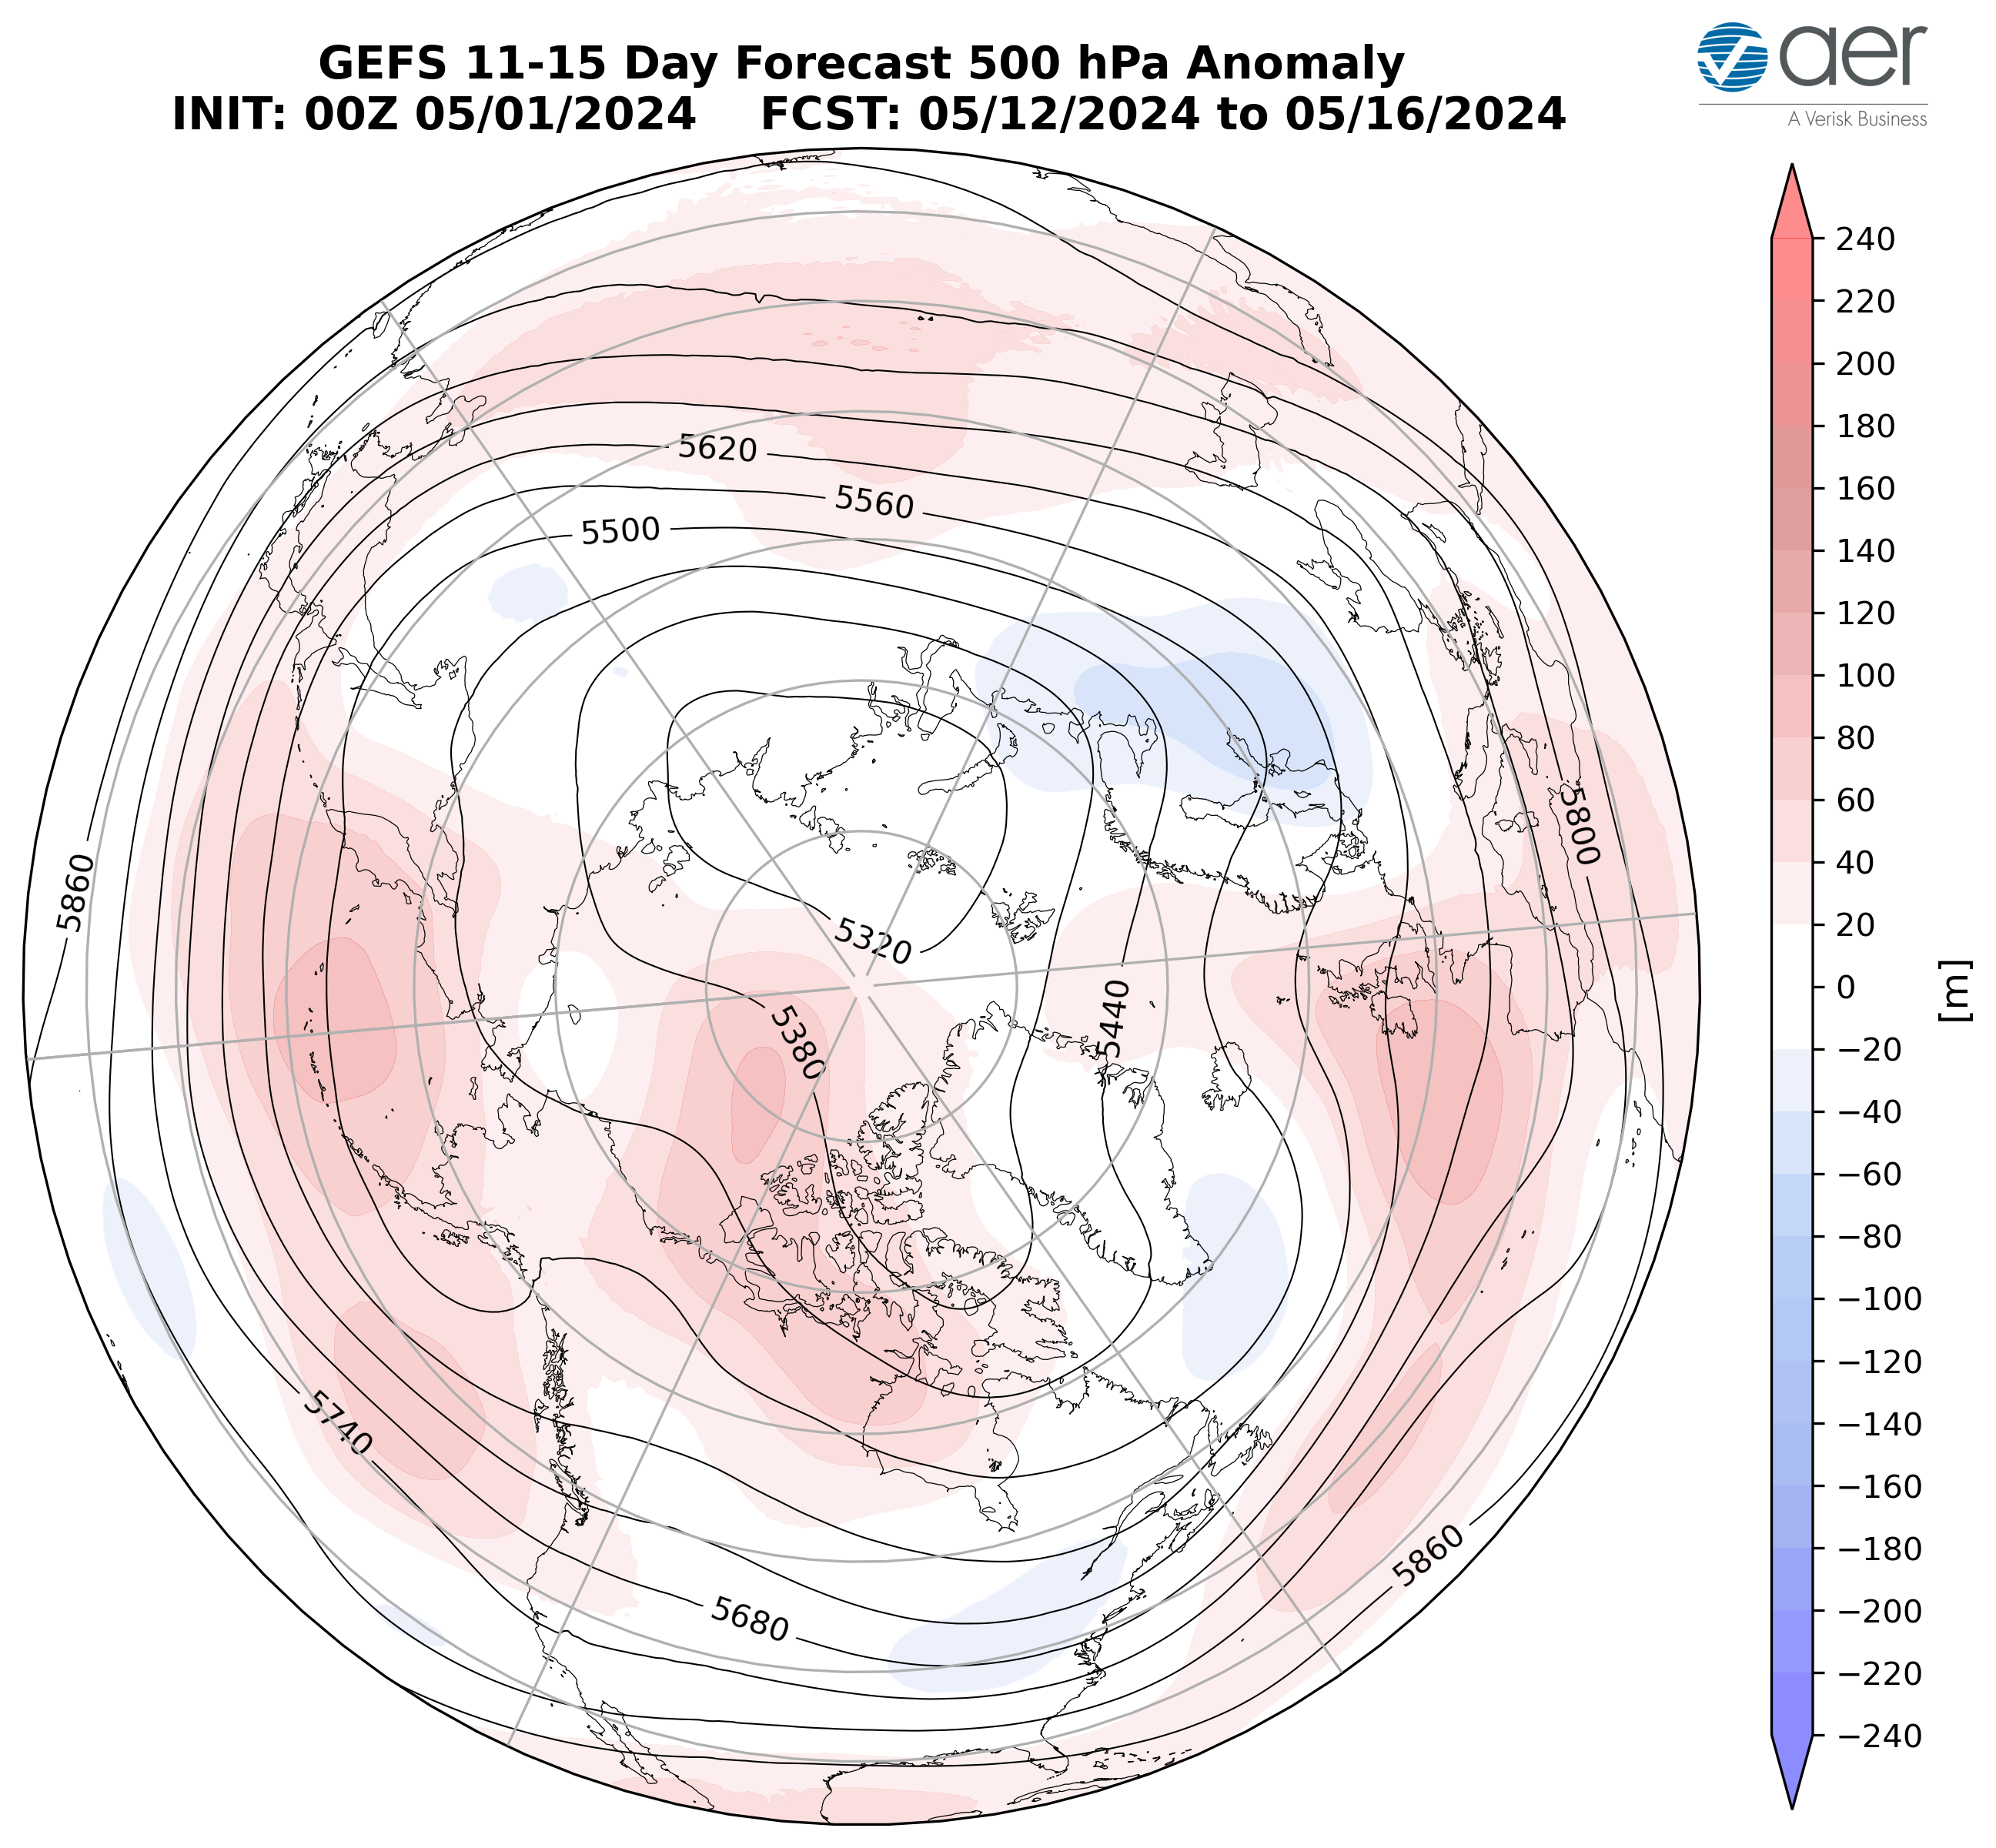
Figure 8. Forecasted average 500 mb geopotential heights (dam; contours) and geopotential height anomalies (m; shading) across the Northern Hemisphere from 12 – 16 May 2024. The forecasts are from the 00z 1 May 2024 2024 GFS ensemble.
Some weak troughing/negative south of Greenland will favor ridging/positive geopotential height anomalies across Western Europe with troughing/negative geopotential height anomalies across Eastern Europe this period (Figure 8). This pattern should favor normal to above normal temperatures across Western Europe including the UK with normal to below normal temperatures across Eastern Europe this period (Figures 9). Ridging/positive geopotential height anomalies are predicted to be widespread across Asia with the exception of weak troughing/negative geopotential height anomalies across Northern Asia but especially Northwestern Asia this period (Figure 8). The predicted pattern favors widespread normal to above normal temperatures across much of Asia with normal to below normal limited to Western Russia this period (Figure 9).
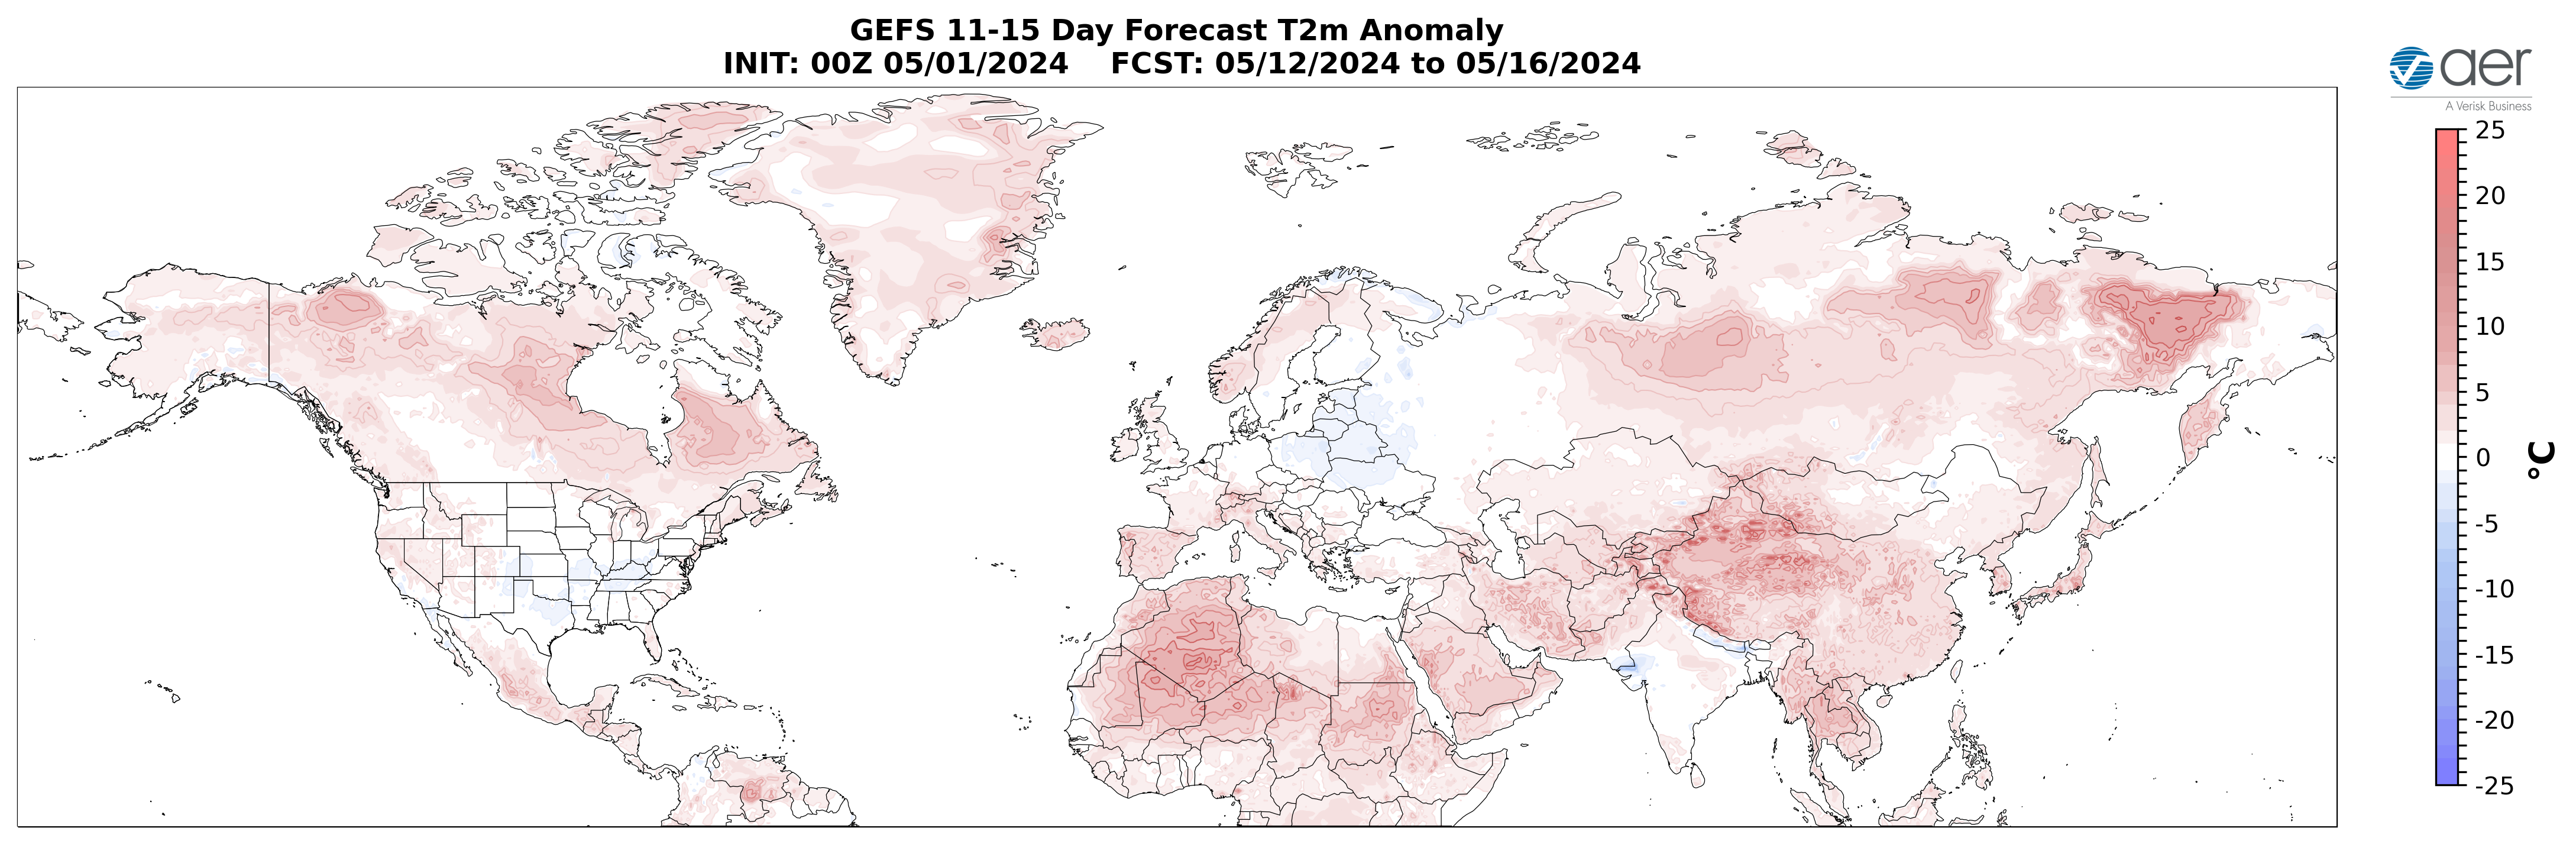
Figure 9. Forecasted surface temperature anomalies (°C; shading) from 12 – 16 May 2024. The forecasts are from the 00z 11 May 2024 2024 GFS ensemble.
Ridging/positive geopotential height anomalies are predicted to spread across western North America helping to develop weak troughing/negative geopotential height anomalies across Eastern Canada and the Eastern US this period (Figure 8). This pattern favors widespread normal to above normal temperatures across Alaska, much of Canada, the Western US and the US East Coast with normal to below normal temperatures limited to the US between the Rockies and the Appalachians and the Canadian Maritimes this period (Figure 9).
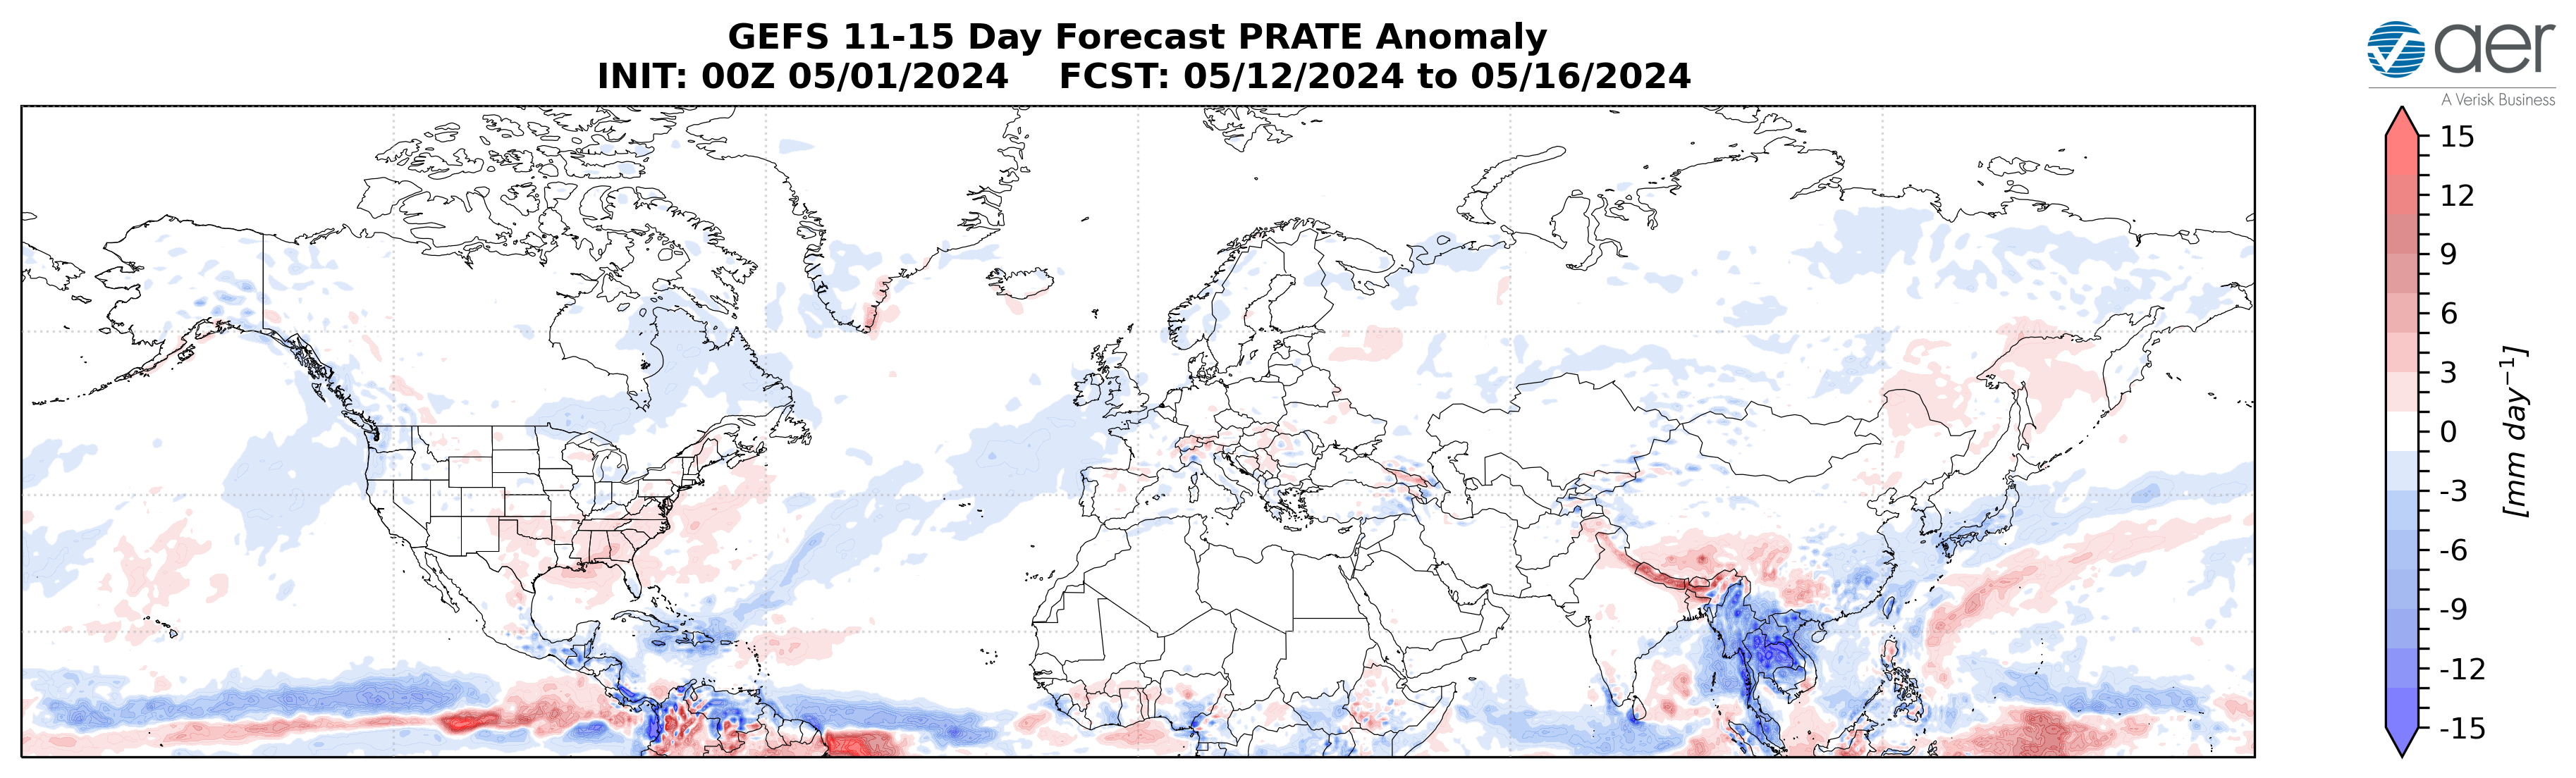
Figure 10. Forecasted precipitation anomalies (mm/day; shading) from 12 – 16 May 2024. The forecast is from the 00Z 1 May 2024 2024 GFS ensemble.
Troughing will support above normal rainfall across Southeastern Europe, the Tibetan Plateau and Southeastern Siberia with normal to below normal rainfall elsewhere across Eurasia this period (Figure 10). Troughing will support above normal rainfall across the Southeastern US with normal to below normal rainfall across the remainder of North America this period (Figure 10).
Longer Term
30–day
The latest plot of the polar cap geopotential height anomalies (PCHs) currently shows warm/positive PCHs throughout the mid and lower stratosphere and the entire troposphere with cold/negative PCHs in the upper stratosphere (Figure 11). Then for the next two weeks warm/positive PCHs in the stratosphere and troposphere will weaken but mostly persist (Figure 11). The warm/positive PCHs anomalies in the lower stratosphere through the troposphere (Figure 11) are associated with the PV disruption/SSW from early March and the Final Warming over the weekend.
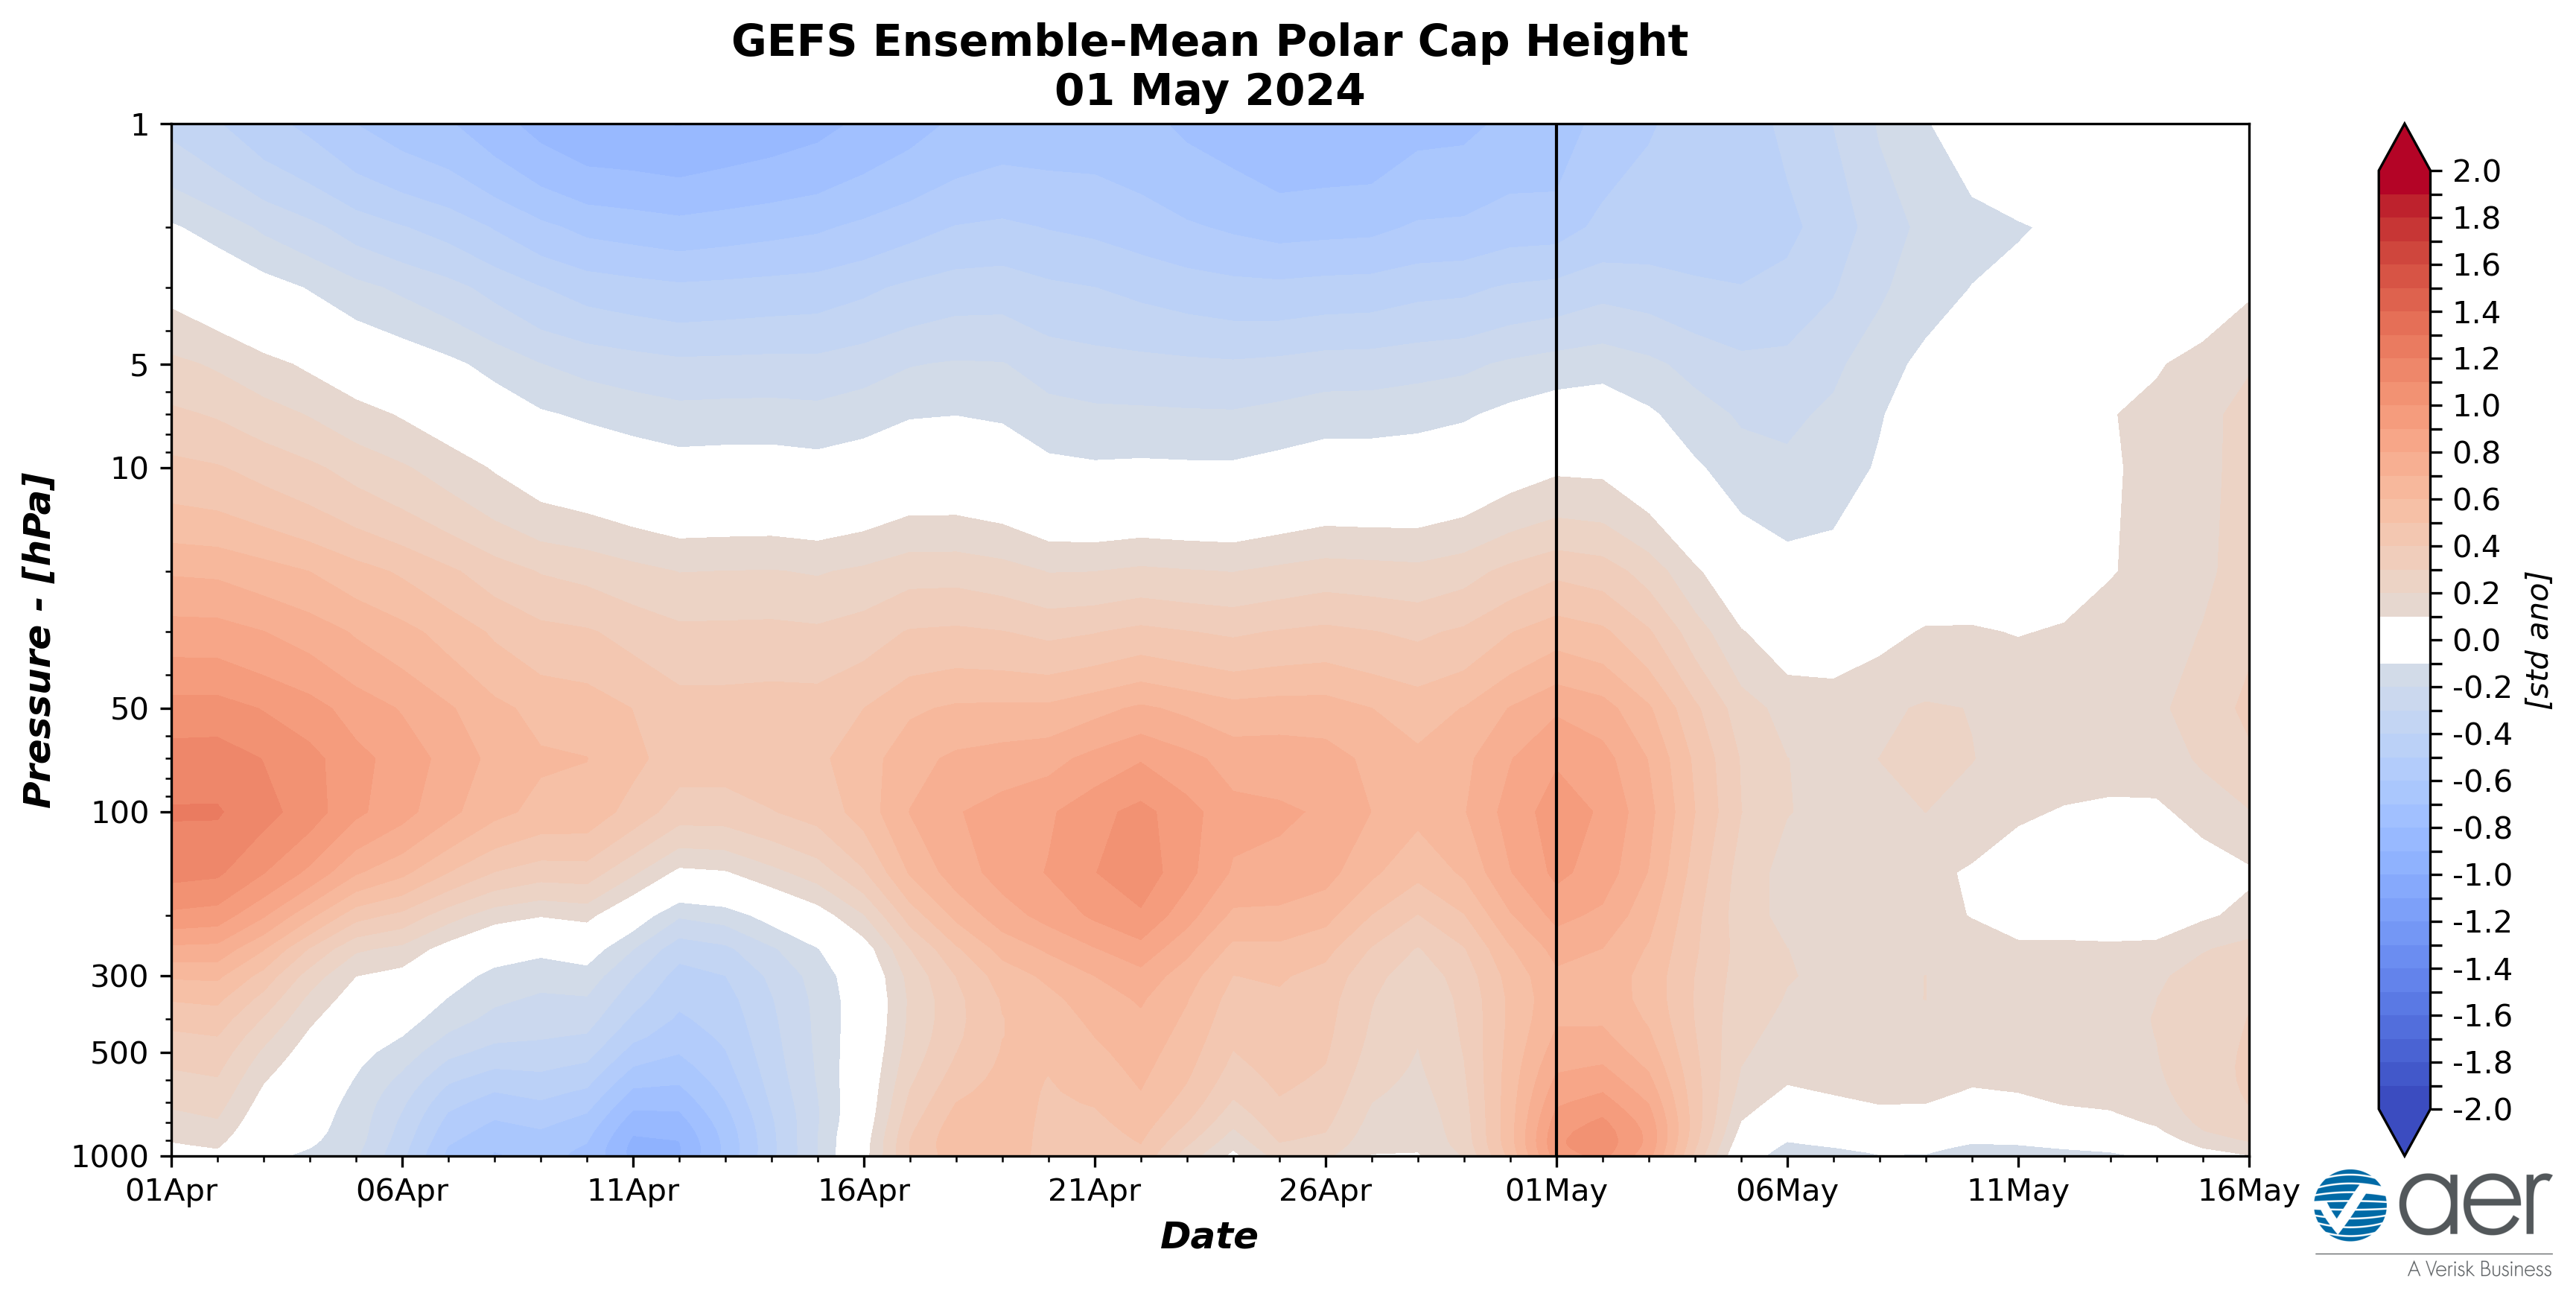
Figure 11. Observed and predicted daily polar cap height (i.e., area-averaged geopotential heights poleward of 60°N) standardized anomalies. The forecast is from the 00Z 1 May 2024 2024 GFS ensemble.
The predicted warm/positive PCHs in the lower troposphere this week (Figure 11) are consistent with the predicted negative surface AO this week (Figure 1). However, starting later this week the neutral to weakly negative surface AO is consistent with switch to weaker warm/positive PCHs in the troposphere.
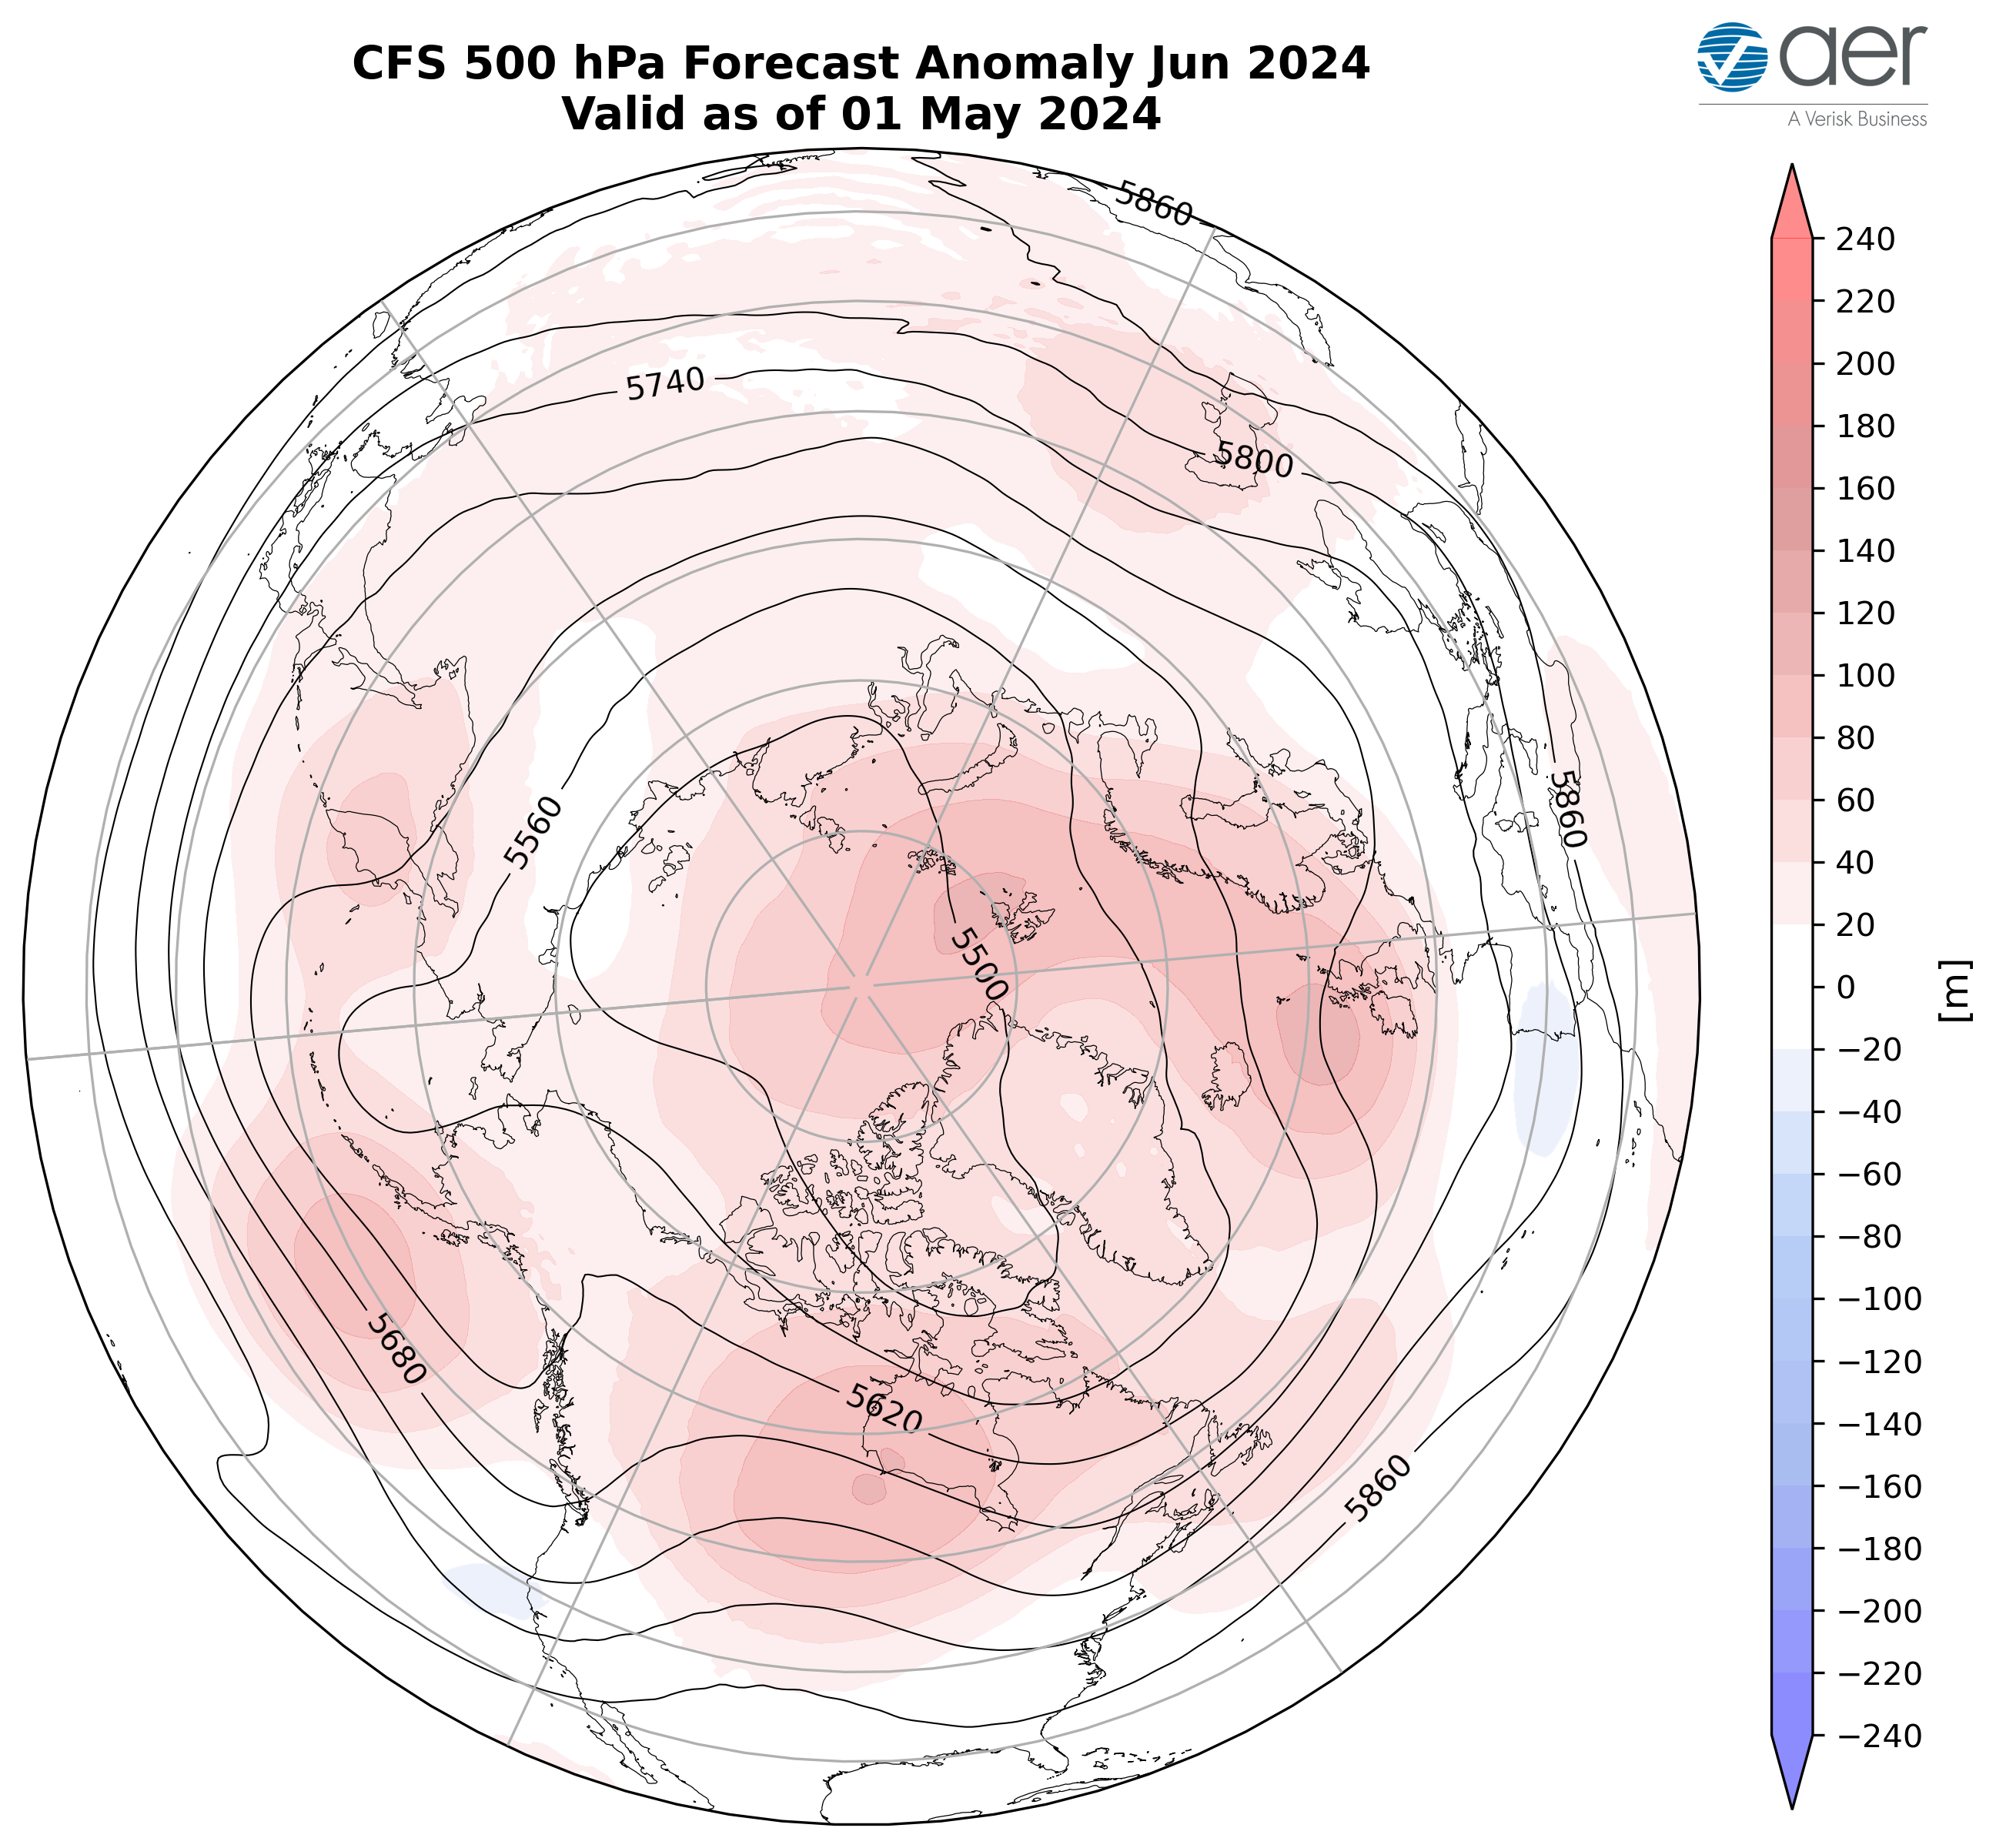
Figure 12. Forecasted average 500 mb geopotential heights (dam; contours) and geopotential height anomalies (m; shading) across the Northern Hemisphere for June 2024. The forecasts are from the 00Z 1 May 2024 2024 CFS.
I include in this week’s blog the monthly 500 hPa geopotential heights (Figure 12) and surface temperatures for June (Figure 13) from the Climate Forecast System (CFS; the plots represent yesterday’s four ensemble members). The forecast for the troposphere is ridging across much of the Arctic including the Barents-Kara Seas, Southwestern Asia, Eastern Siberia, the Gulf of Alaska, Alaska and much of Canada with troughing in Southwestern Europe, Central Asia, the Southwestern US, Eastern Canada and the Eastern US (Figure 12). This pattern favors seasonable to relatively warm temperatures across much of Europe, much of Asia, Alaska, much of Canada, the Northwestern and Northeastern US with seasonable to relatively cool temperatures across the Iberian Peninsula, Kazakhstan, the Southwestern US and the Southeastern US (Figure 13).
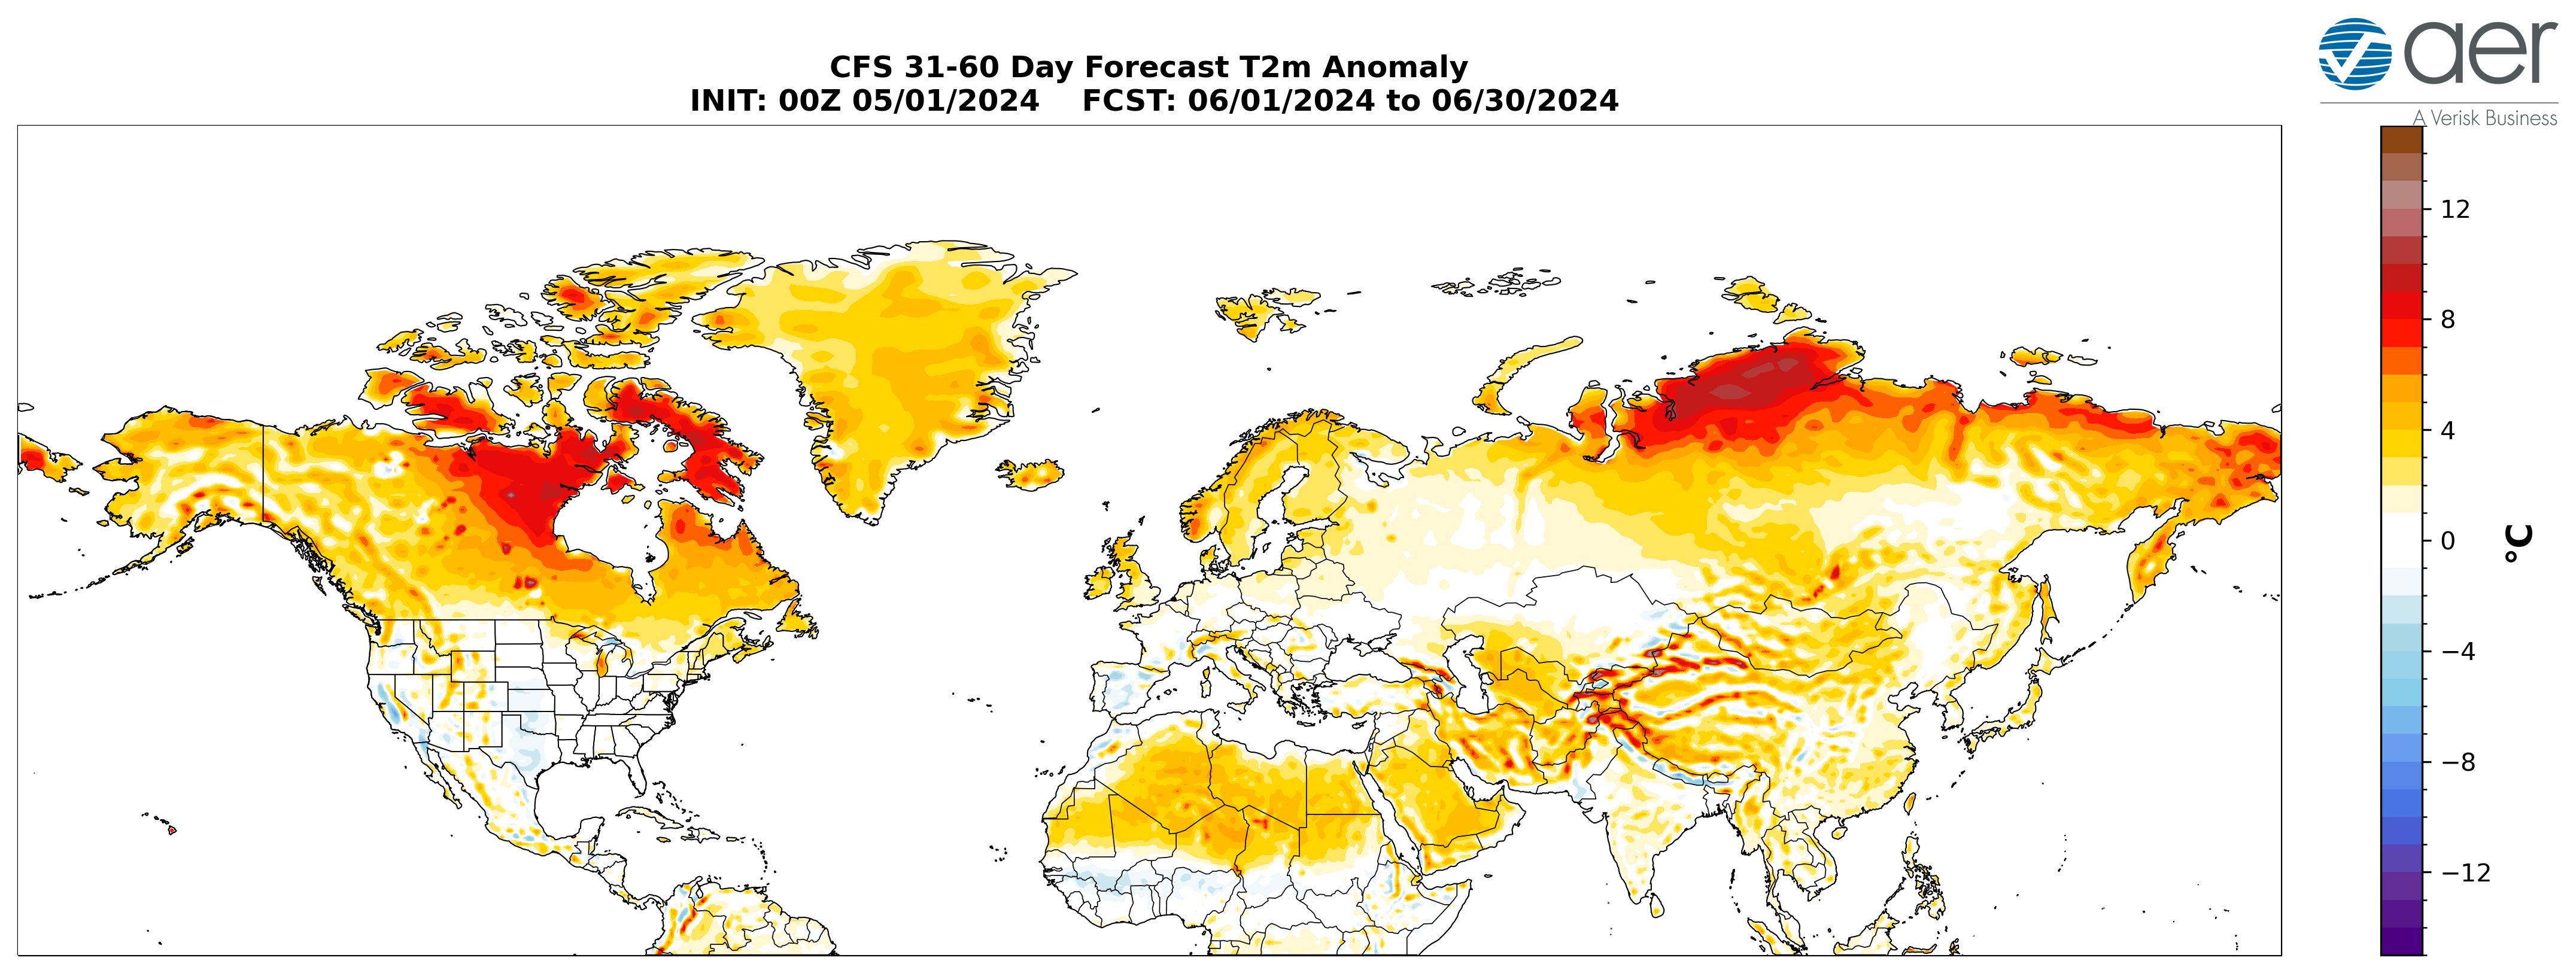
Figure 13. Forecasted average surface temperature anomalies (°C; shading) across the Northern Hemisphere for June 2024. The forecasts are from the 00Z 1 May 2024 CFS.
SSTs/El Niño/Southern Oscillation
Equatorial Pacific sea surface temperatures (SSTs) anomalies are well above normal, especially along the South America coast, indicating tEl Niño conditions but it is weakening (Figure 14) and Neutral conditions are expected through the the summer. Observed SSTs across the NH remain well above normal especially in the central North Pacific (west of recent years), the western North Pacific, the eastern North Atlantic and offshore of eastern North America though below normal SSTs exist regionally especially in the South and North Pacific and the North Atlantic.
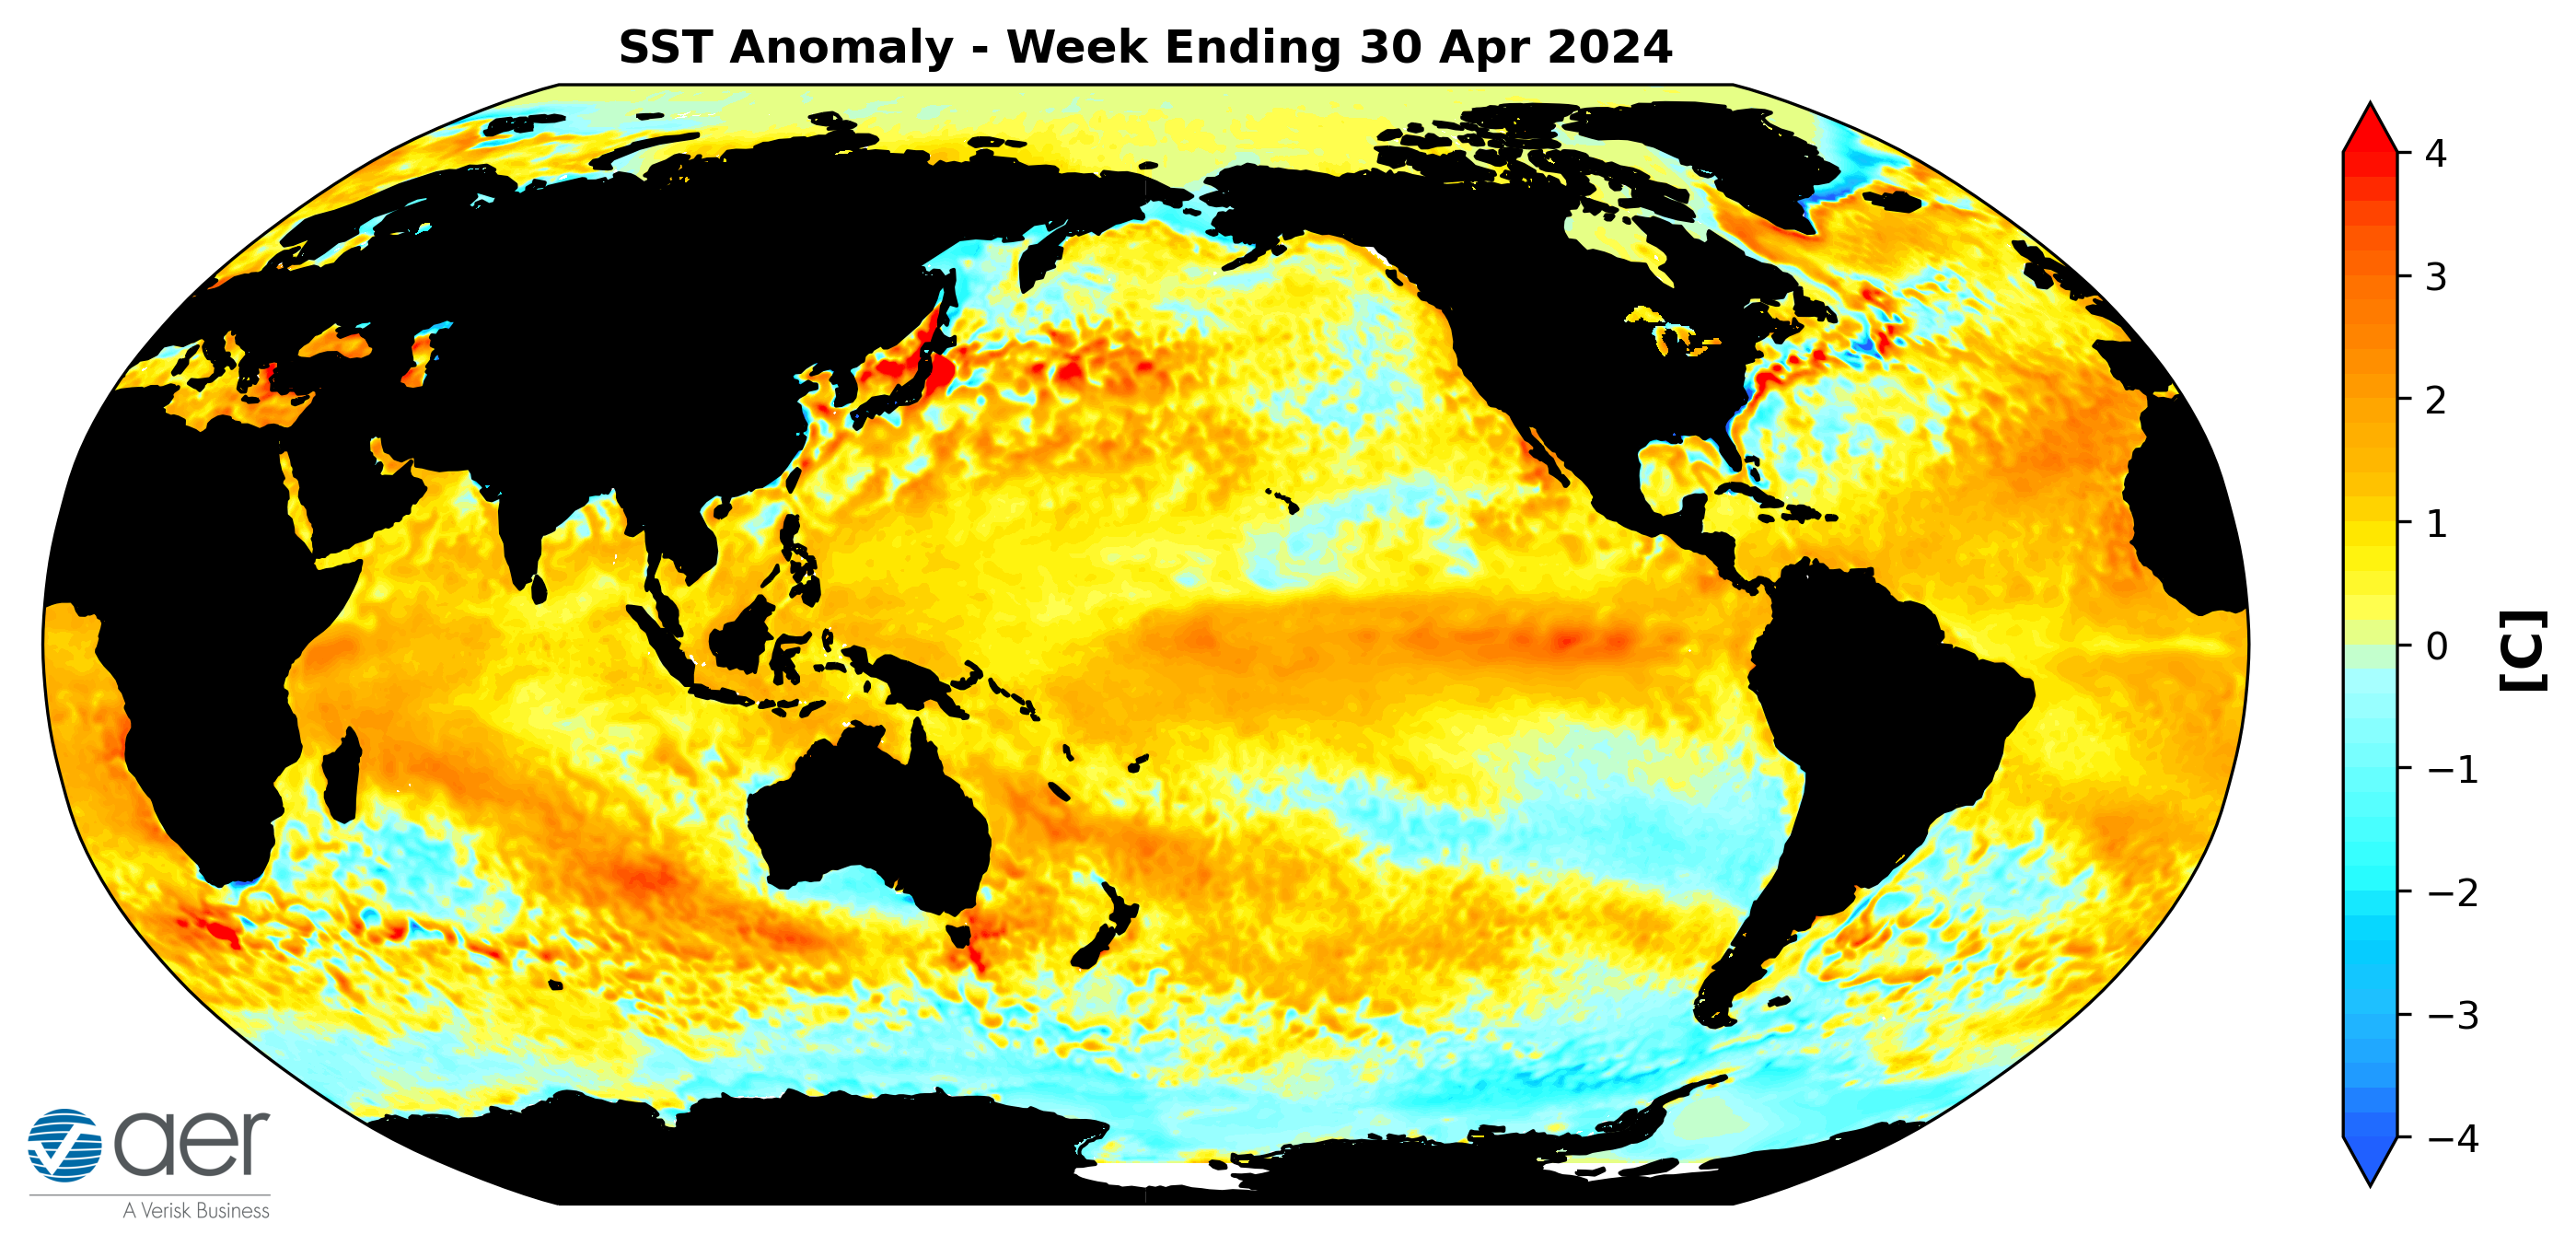
Figure 14. The latest weekly-mean global SST anomalies (ending 30 April 2024). Data from NOAA OI High-Resolution dataset.
Madden Julian Oscillation
Currently the Madden Julian Oscillation (MJO) is in phase four (Figure 15). The forecasts are for the MJO to quickly weaken to where no phase is favored. Phase four favors troughing in the interior of Canada and therefore the MJO seems to be having little influence on the weather across North America weather this week into next week. But admittedly this is outside of my expertise.
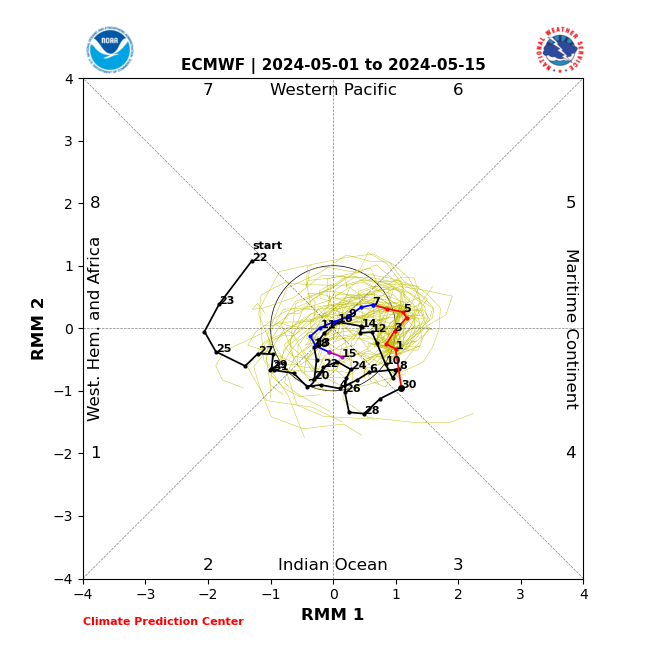
Figure 15. Past and forecast values of the MJO index. Forecast values from the 00Z 1 May 2024 ECMWF model. Yellow lines indicate individual ensemble-member forecasts, with the green line showing the ensemble-mean. A measure of the model “spread” is denoted by the gray shading. Sector numbers indicate the phase of the MJO, with geographical labels indicating where anomalous convection occurs during that phase. Image source: https://www.cpc.ncep.noaa.gov/products/precip/CWlink/MJO/CLIVAR/clivar_wh.shtml
Get Detailed Seasonal Weather Intelligence with sCast
We appreciate your taking the time to read the public Arctic Oscillation blog from Dr. Judah Cohen and the AER Seasonal Forecasting team.
Dr. Cohen’s detailed monthly seasonal forecast, sCast, is also available for purchase. sCast provides a monthly 30-60-90-180-day outlook into temperature and precipitation, solar flux and wind anomalies across the globe, and regional population weighted cooling and heating degree forecasts for the US.
Our sCast principal engineer, Karl Pfeiffer, can help you use sCast and other AER seasonal forecast products to deliver important, long-lead time weather intelligence to your business. Please reach out to Karl today!

 (click image to play)