April 15, 2024
Dr. Judah Cohen from Atmospheric and Environmental Research (AER) embarked on an experimental process of regular research, review, and analysis of the Arctic Oscillation (AO) and Polar Vortex (PV). This analysis is intended to provide researchers and practitioners real-time insights on one of North America’s and Europe’s leading drivers for extreme and persistent temperature patterns.
During the winter schedule the blog is updated once every week. Snow accumulation forecasts replace precipitation forecasts. Also, there is renewed emphasis on ice and snow boundary conditions and their influence on hemispheric weather. In late Spring, we transition to a spring/summer schedule, which is once every two weeks. Snow accumulation forecasts will be replaced by precipitation forecasts. Also, there will be less emphasis on ice and snow boundary conditions and their influence on hemispheric weather
Subscribe to our email list or follow me on Twitter (@judah47) for notification of updates.
The AO/PV blog is partially supported by NSF grant AGS: 1657748.
Summary
- The Arctic Oscillation (AO) is currently positive and is predicted to trend negative this week as pressure/geopotential height anomalies across the Arctic are currently mostly negative but then pressure/geopotential height anomalies across the Arctic turn more mixed to positive. The North Atlantic Oscillation (NAO) is currently positive with mostly negative pressure/geopotential height anomalies across Greenland and the NAO is predicted to trend negative the next two weeks as pressure/geopotential height anomalies turn more positive across Greenland.
- Increasing ridging/positive geopotential height anomalies across Greenland the next two weeks will support deepening troughing/negative geopotential height anomalies across Europe with residual ridging/positive geopotential height anomalies across Southern and Eastern Europe the next two weeks. This pattern will support normal to above normal temperatures across much of Europe including the United Kingdom (UK) with normal to below normal temperatures limited to Southeastern Europe the next two weeks.
- The general predicted pattern across Asia the next two weeks is ridging/positive geopotential height anomalies dominating Western and Eastern Asia bookending troughing/negative geopotential height anomalies across Central Asia. This pattern favors widespread normal to above normal temperatures across much of Asia the next two weeks with the exceptions of normal to below normal temperatures across far Northern Siberia and Western Siberia mostly next week.
- The predicted pattern general pattern across North America the next two weeks is strong ridging/positive geopotential height anomalies centered over Alaska and the west coast of North America forcing troughing/negative geopotential height anomalies first in the interior and then across Eastern Canada and the Eastern United States (US). However, the during the last week of April, ridging/positive geopotential height anomalies will become more widespread across North America. This pattern favors normal to above normal temperatures across Alaska Western and Eastern Canada and the Western and Eastern US with normal to below normal temperatures in the Plains of Canada and the Northern US this week. Then next week normal to below normal temperatures will spread into Eastern Canada and the Eastern US. However the last week of April, normal to above normal temperatures will once again become widespread across Canada and the US.
- In the Impacts section I discuss the ongoing impacts to Northern Hemisphere (NH) weather from the large disruption of the polar vortex (PV) in early March and the Final Warming.
Plain Language Summary
Episodic influence from the large polar vortex (PV) disruption in early March is still ongoing. Predicted cooler temperatures in the Eastern US and Europe (see Figure 6) are related to high latitude blocking that has at least parts of its origins to the PV disruption. Otherwise the atmosphere is setting itself up for an overall hot summer (see Figure 13).
Impacts
The polar vortex (PV) lives another day. Normally the Final Warming (where the PV disappears until the fall) takes place around now, however, it seems that the strongly positive AO and lack of high latitude blocking has given the PV a second life and it could hang around until the end of the month. The Final Warming (FW) can impact the weather if it is a dynamic (FW) similar to a sudden stratospheric warming (SSW) but so far no sign of this. Still the weather models are predicting the return of Ural blocking so can’t rule it out.
But the impacts from the large polar vortex (PV) disruption/sudden stratospheric warming (SSW), from early March are still influencing the weather. High latitude blocking in the North Atlantic is bringing the return of cooler and wetter weather to Europe, just in time for my arrival in Europe to attend the European Geophysical Union conference in Vienna. Some high latitude blocking near Alaska will also support cooler weather in the Eastern US. From Figure 11, I would argue that this latest round of high latitude blocking is related to the SSW during the first week of March.
Otherwise, it looks like the atmosphere is quickly transitioning to the summer pattern of recent years with ridging encircling the NH high-latitude continents. This should accelerate continental spring snow melt and bring widespread above normal temperatures but focused along the northern edge of the continents.
Wednesday Update
Being in Euope has provided me a perspective from the other side of the pond. Some have suggested to me that the tropospheric response or the influence to our weather from the large PV disruption back in early March is not typical. But to me it looks fairly classical, just unusually late in the season. Looking at the latest PCHs we observe the long and continuous duration of positive/warm PCHs in the lower stratosphere. We also see the episodic downward propagation or “drips”of those PCHs to the troposphere and surface (see Figure i).
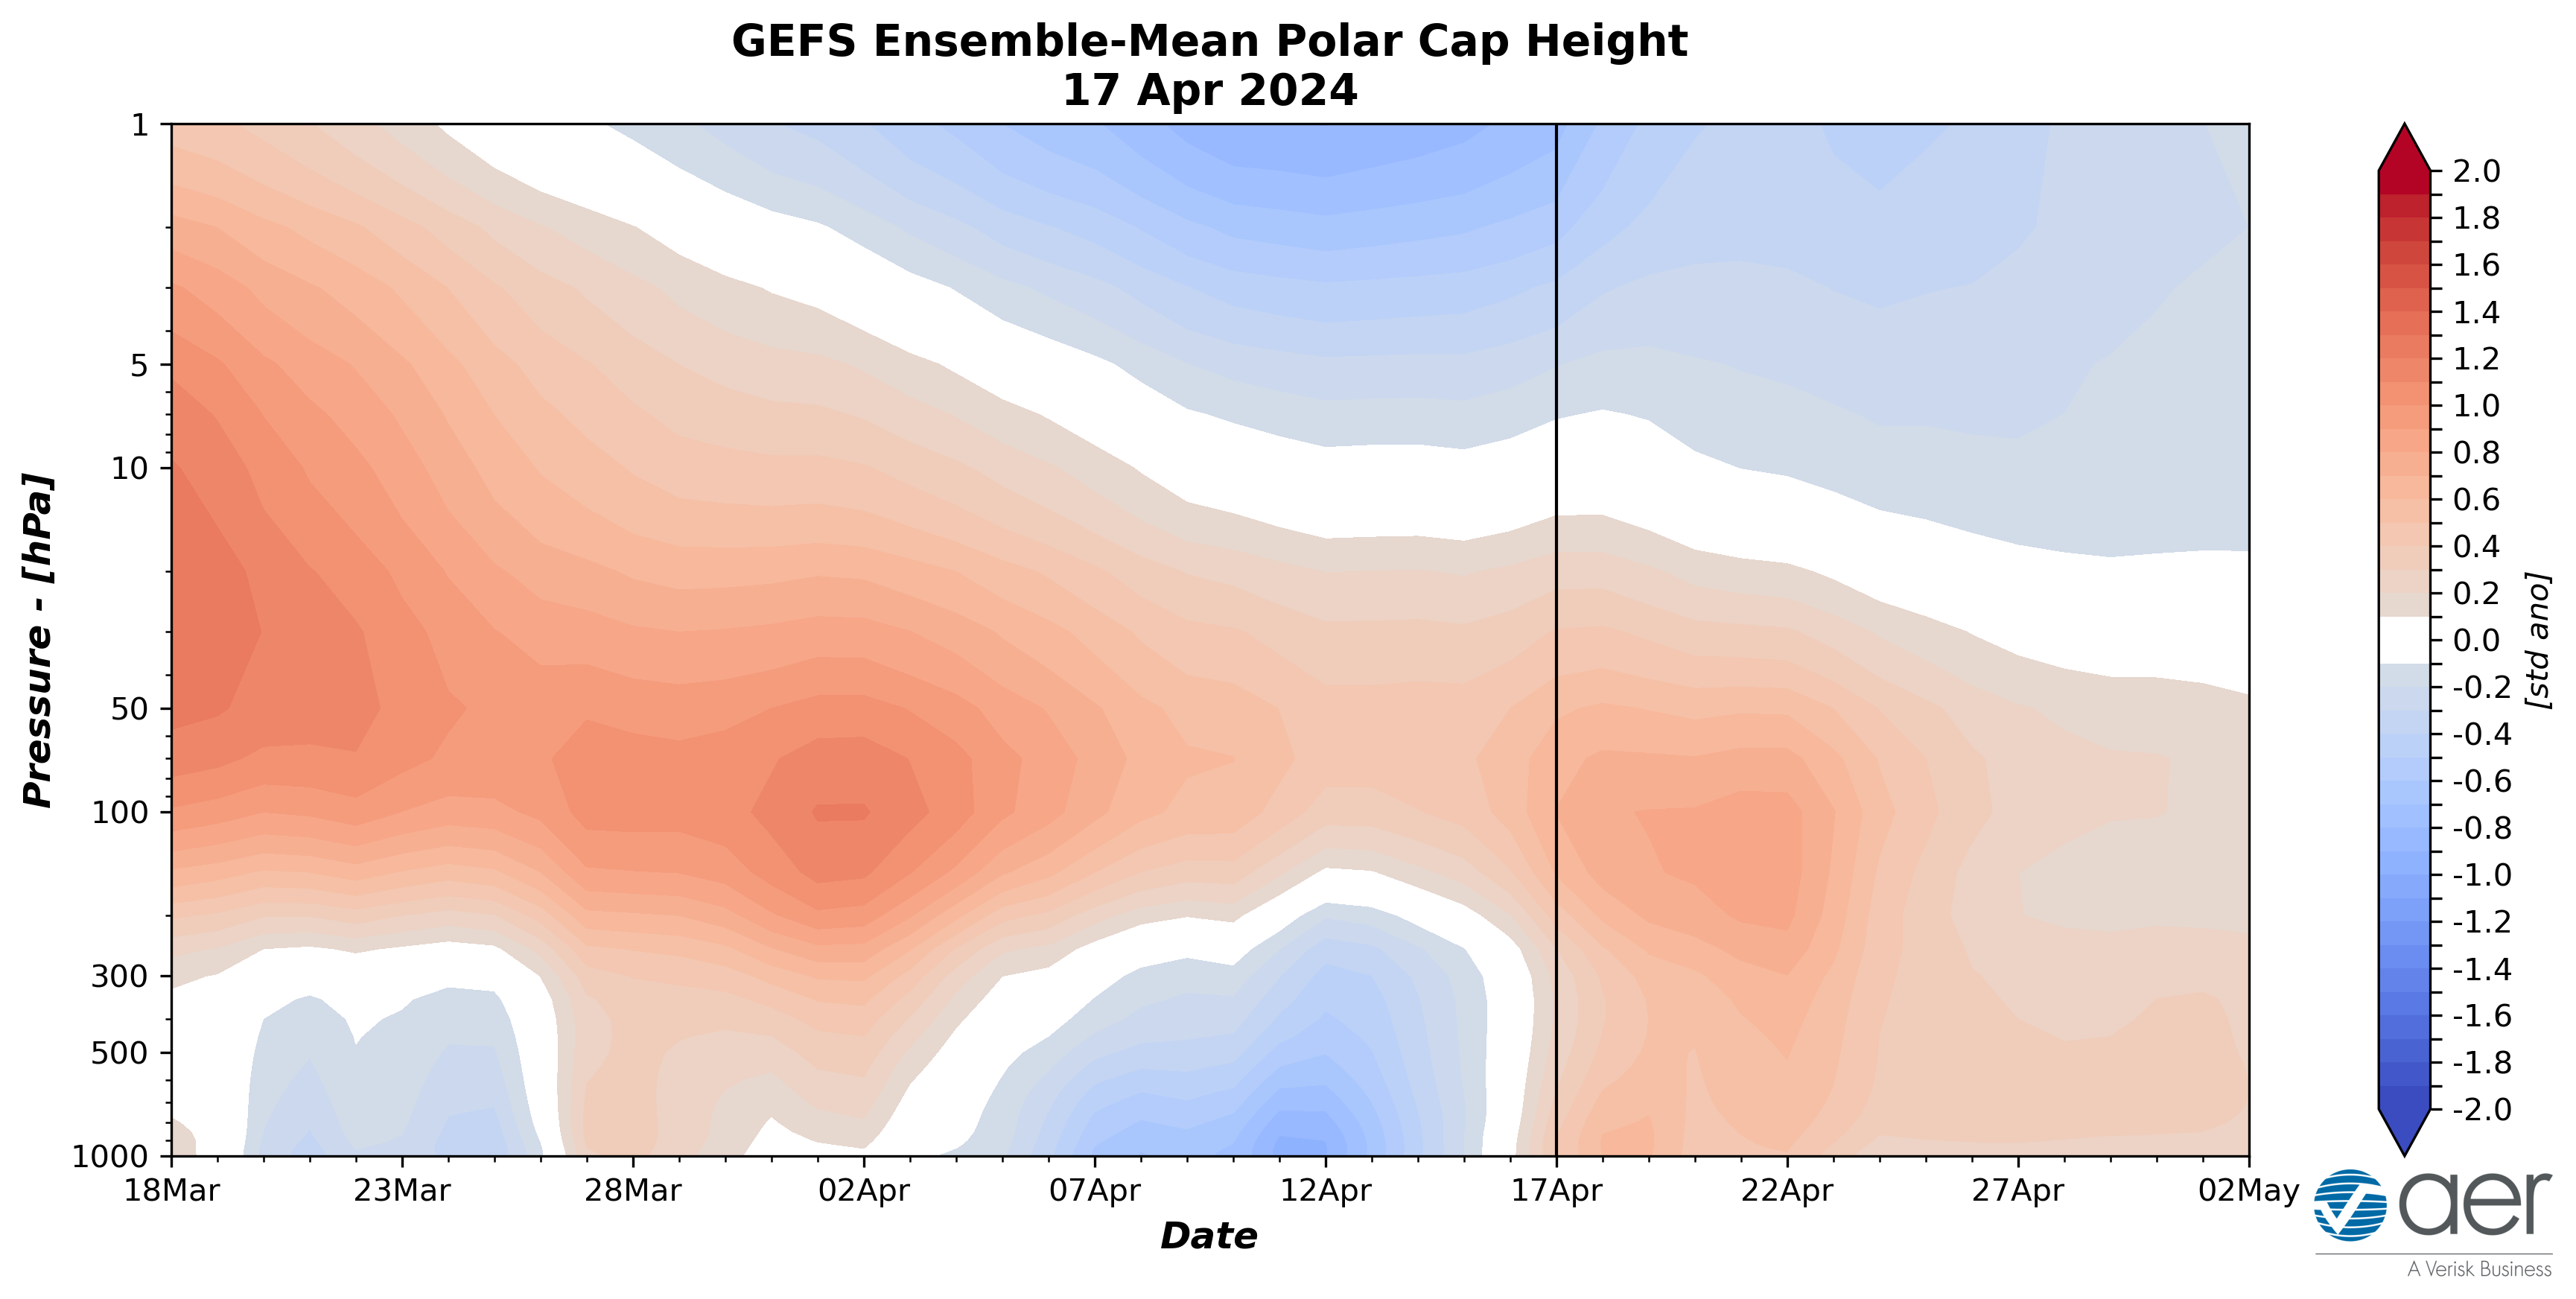
Figure i. Observed and predicted daily polar cap height (i.e., area-averaged geopotential heights poleward of 60°N) standardized anomalies. The forecast is from the 00Z 17 April 2024 2024 GFS ensemble.
Also, we have seen previously but maybe more impressively this week, episodic Greenland blocking (see Figure ii). I am getting to the enjoy the resulting cold weather in Europe (that is me being sarcastic, I am no fan of cold with no snow). And had this PV disruption happened in January, it might have been remembered differently, especially in Europe. And this second large PV disruption or SSW of the winter is in contrast to the first one in January, which clearly was not classical. At least from the perspective of troposphere-stratosphere coupling an interesting winter indeed.
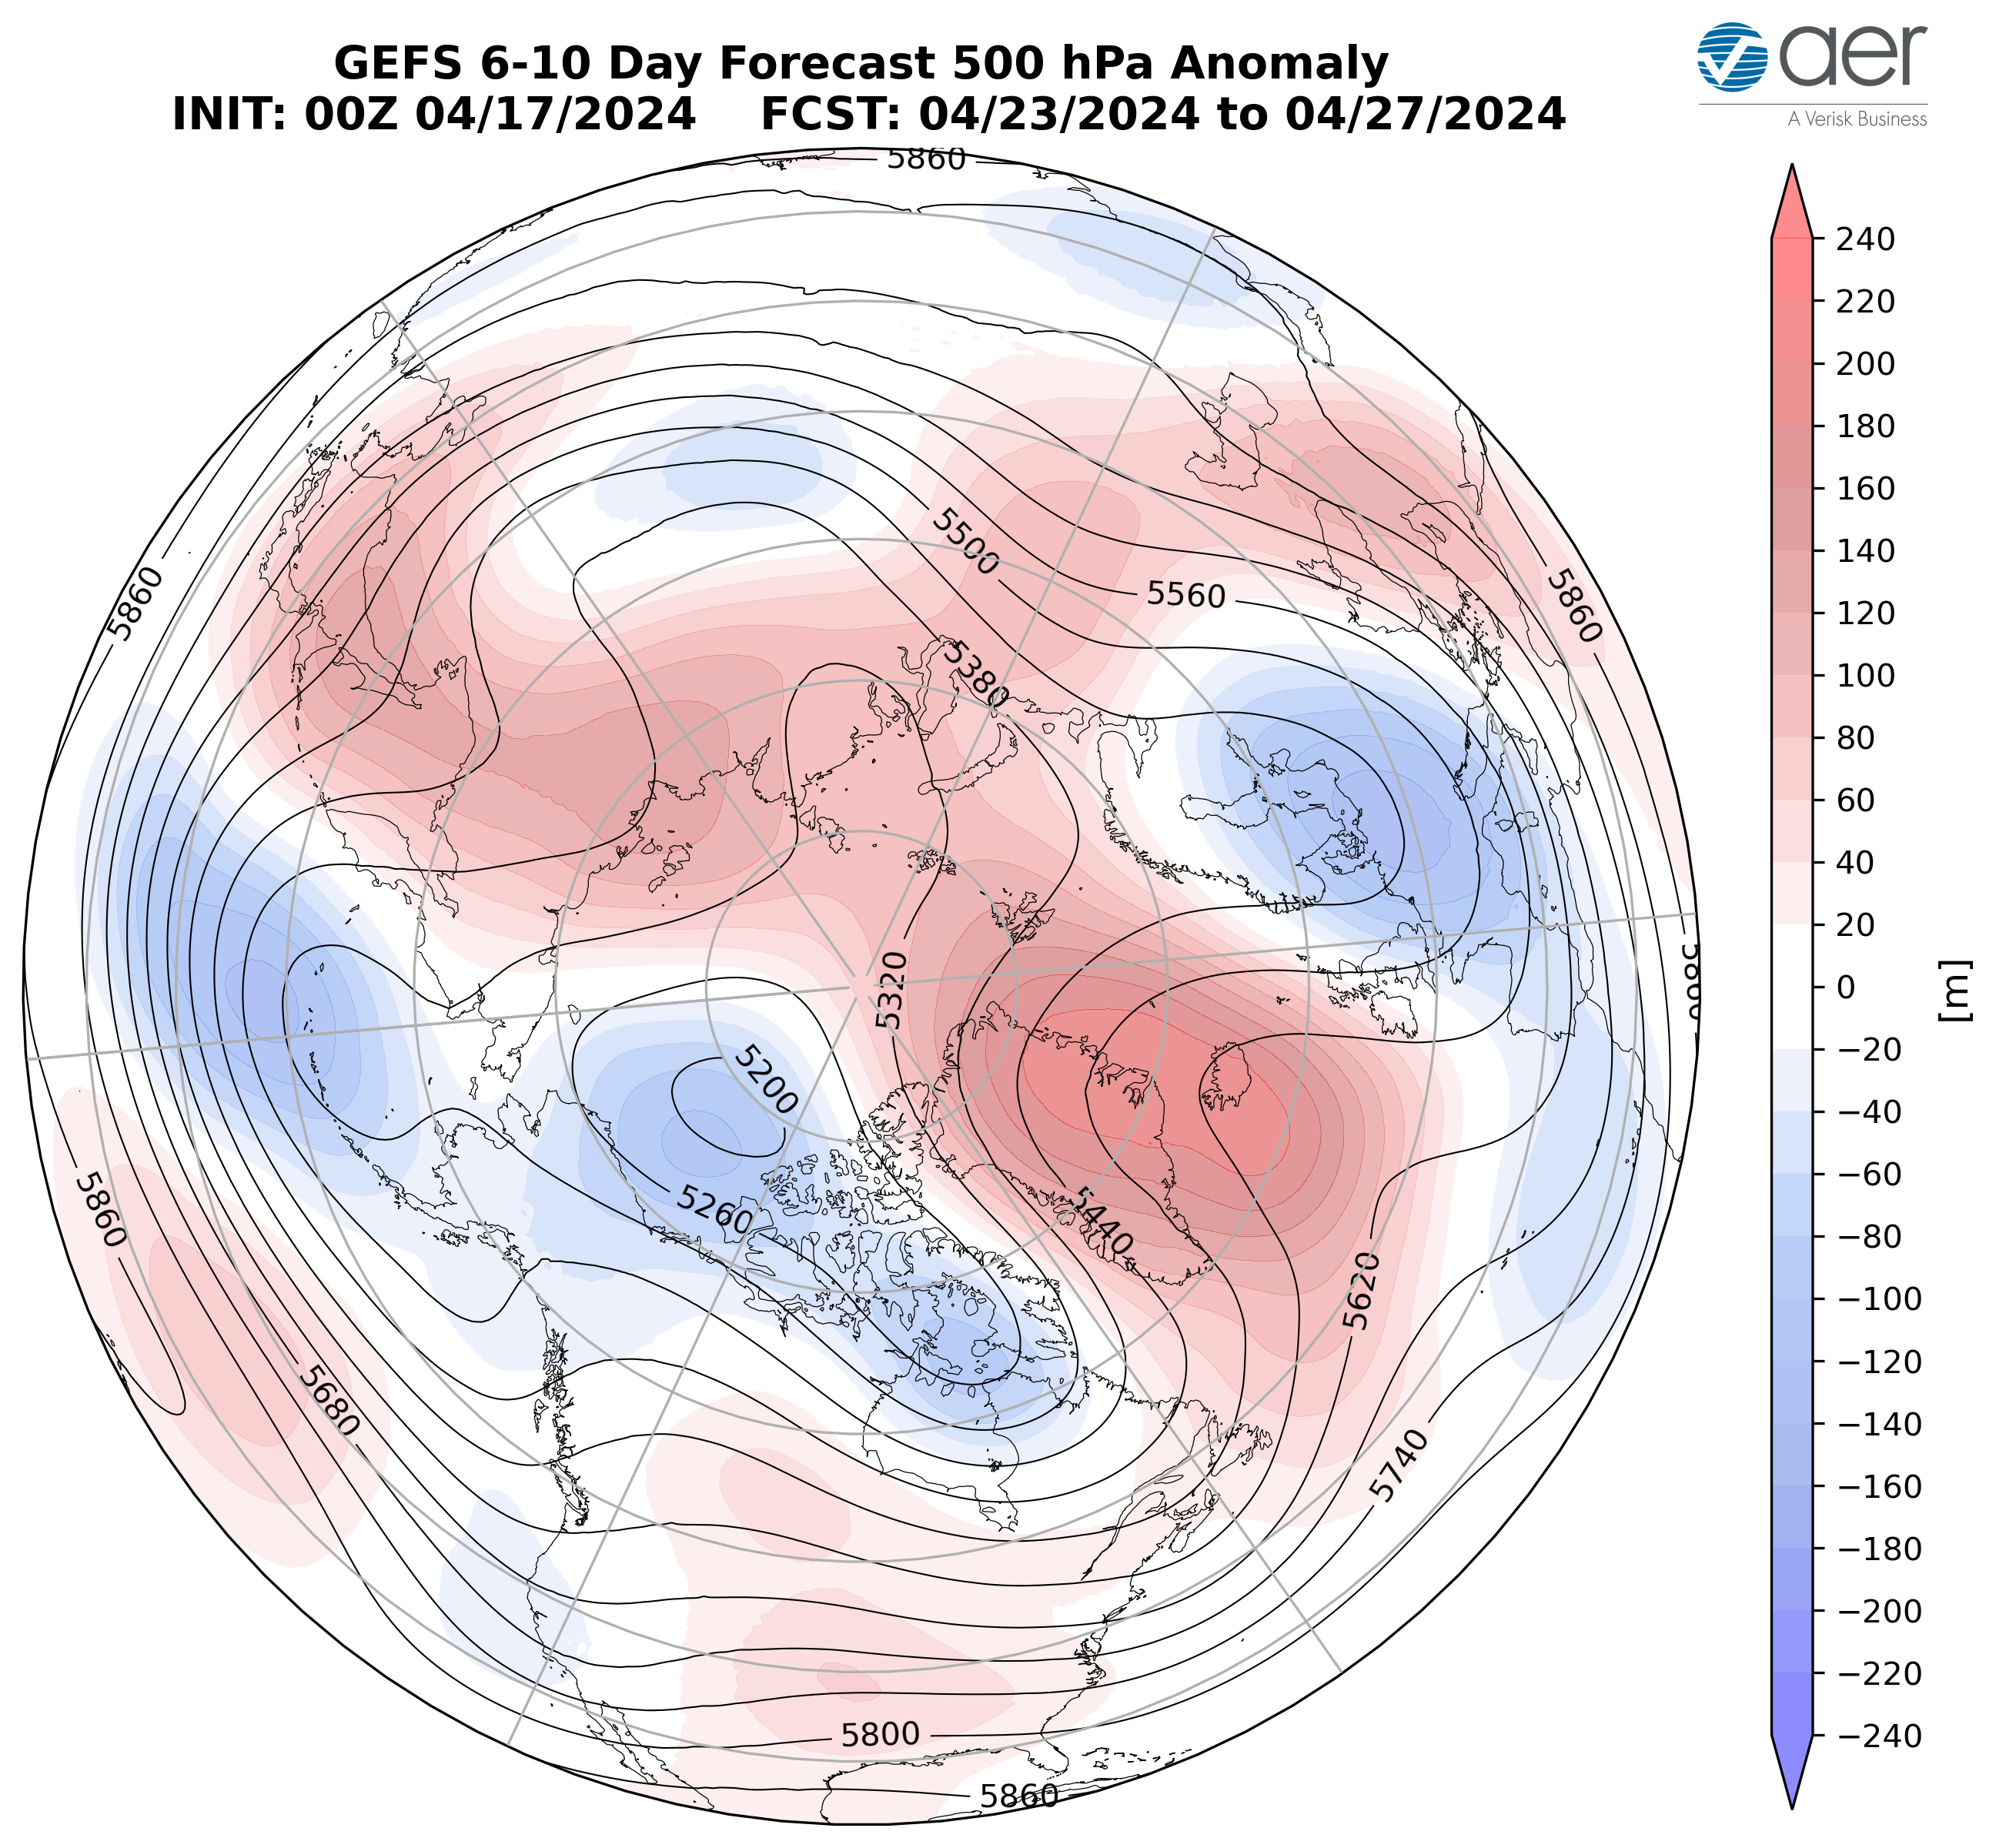
Figure ii. Forecasted average 500 mb geopotential heights (dam; contours) and geopotential height anomalies (m; shading) across the Northern Hemisphere from 23 – 27 April 2024. The forecasts are from the 00z 17 April 2024 2024 GFS ensemble.
Near-Term
This week
The AO is predicted to be positive this week (Figure 1) with moistly negative geopotential height anomalies across the Arctic and with mixed geopotential height anomalies across the mid-latitudes of the NH (Figure 2). With predicted negative geopotential height anomalies across Greenland (Figure 2), the NAO is predicted to be positive this week.
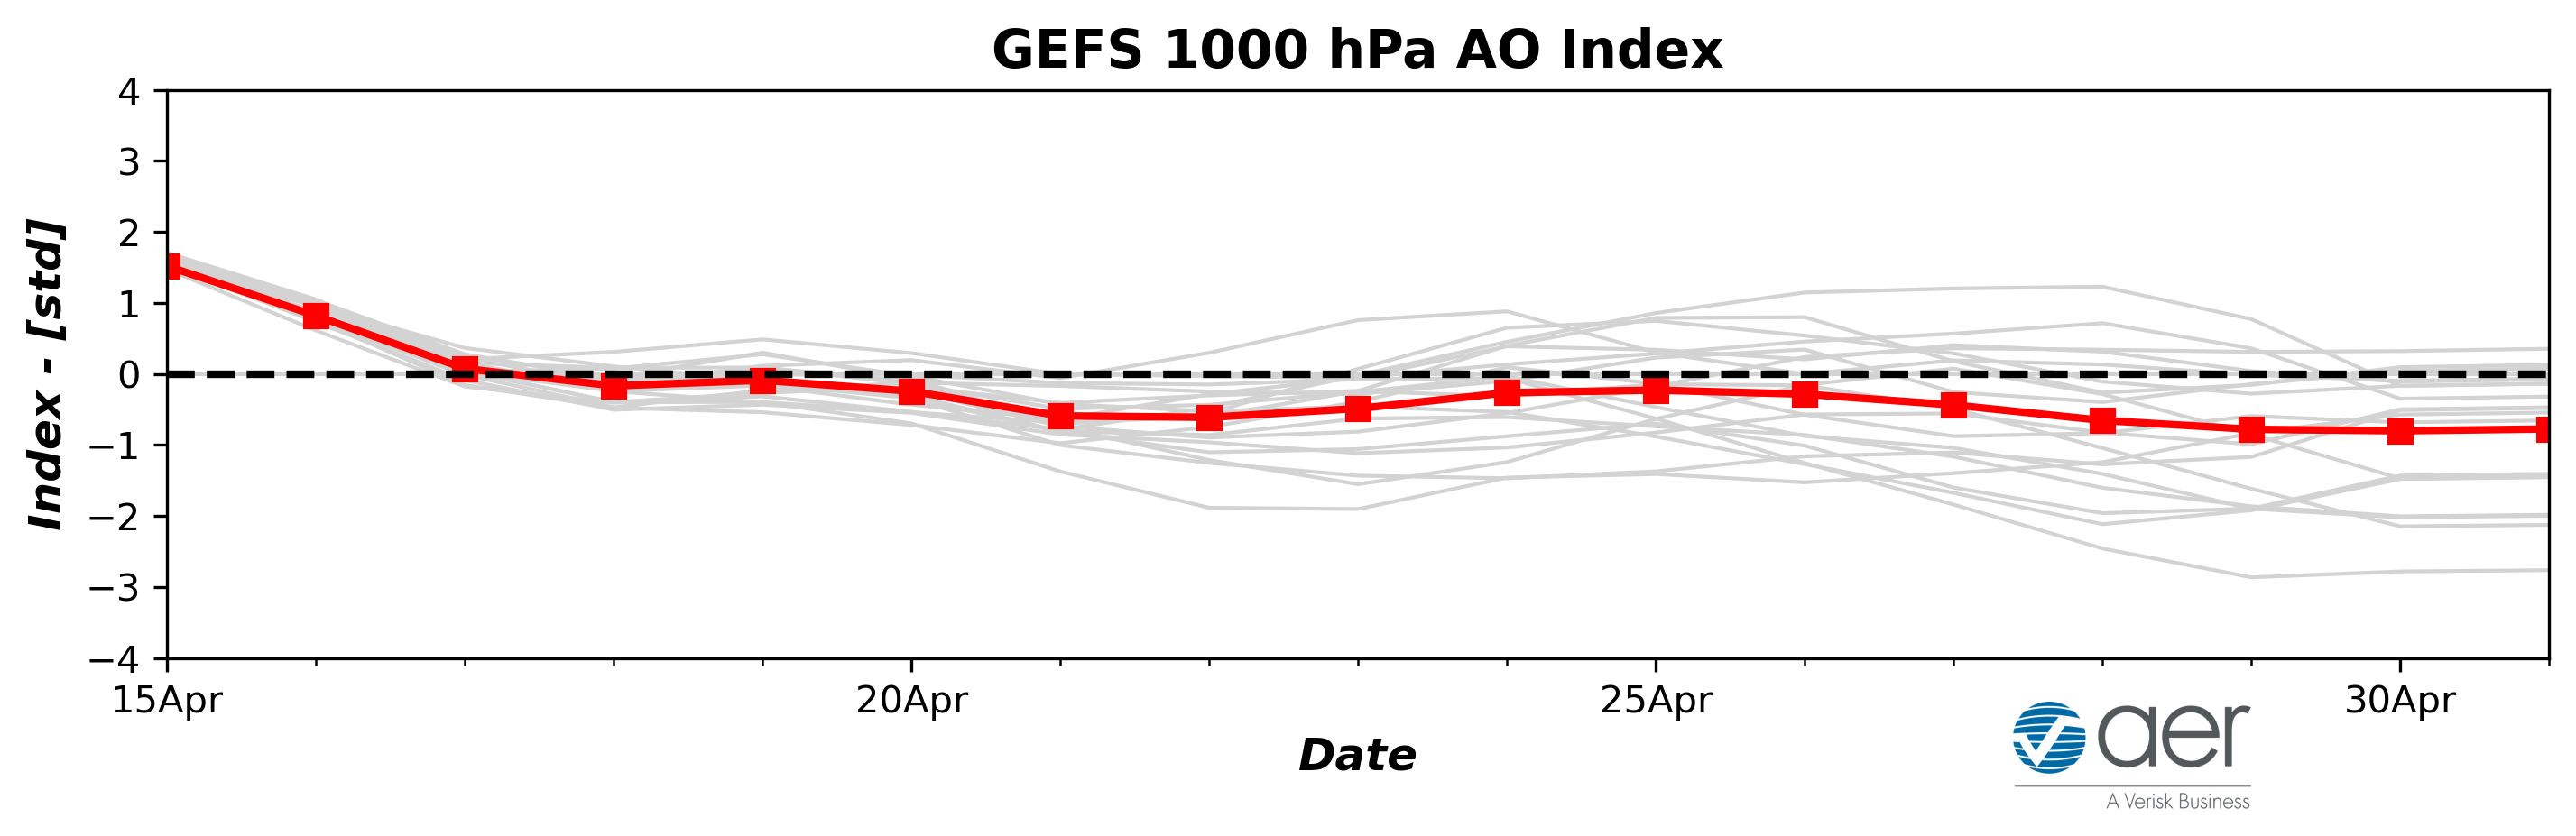
Figure 1. The predicted daily-mean AO at 1000 hPa from the 00Z 15 April 2024 2024 GFS ensemble. Gray lines indicate the AO index from each individual ensemble member, with the ensemble-mean AO index given by the red line with squares.
This week, ridging/positive geopotential height anomalies centered south of Greenland and Iceland will force troughing/negative geopotential height anomalies across much of Europe with ridging/positive geopotential height anomalies persisting across Southern and Eastern Europe (Figures 2). This pattern favors normal to above normal temperatures across Northern and Western Europe including the UK with normal to below normal temperatures across Southern and Eastern Europe (Figure 3). Ridging/positive geopotential height anomalies are predicted to dominate Asia with the exception of troughing/negative geopotential height anomalies across far northwestern Asia and north of the Persian Gulf this period (Figure 2). This pattern favors widespread normal to above normal temperatures across much of Asia with normal to below normal temperatures limited to far northwestern Asia and the countries that border the Persian Gulf (Figure 3).
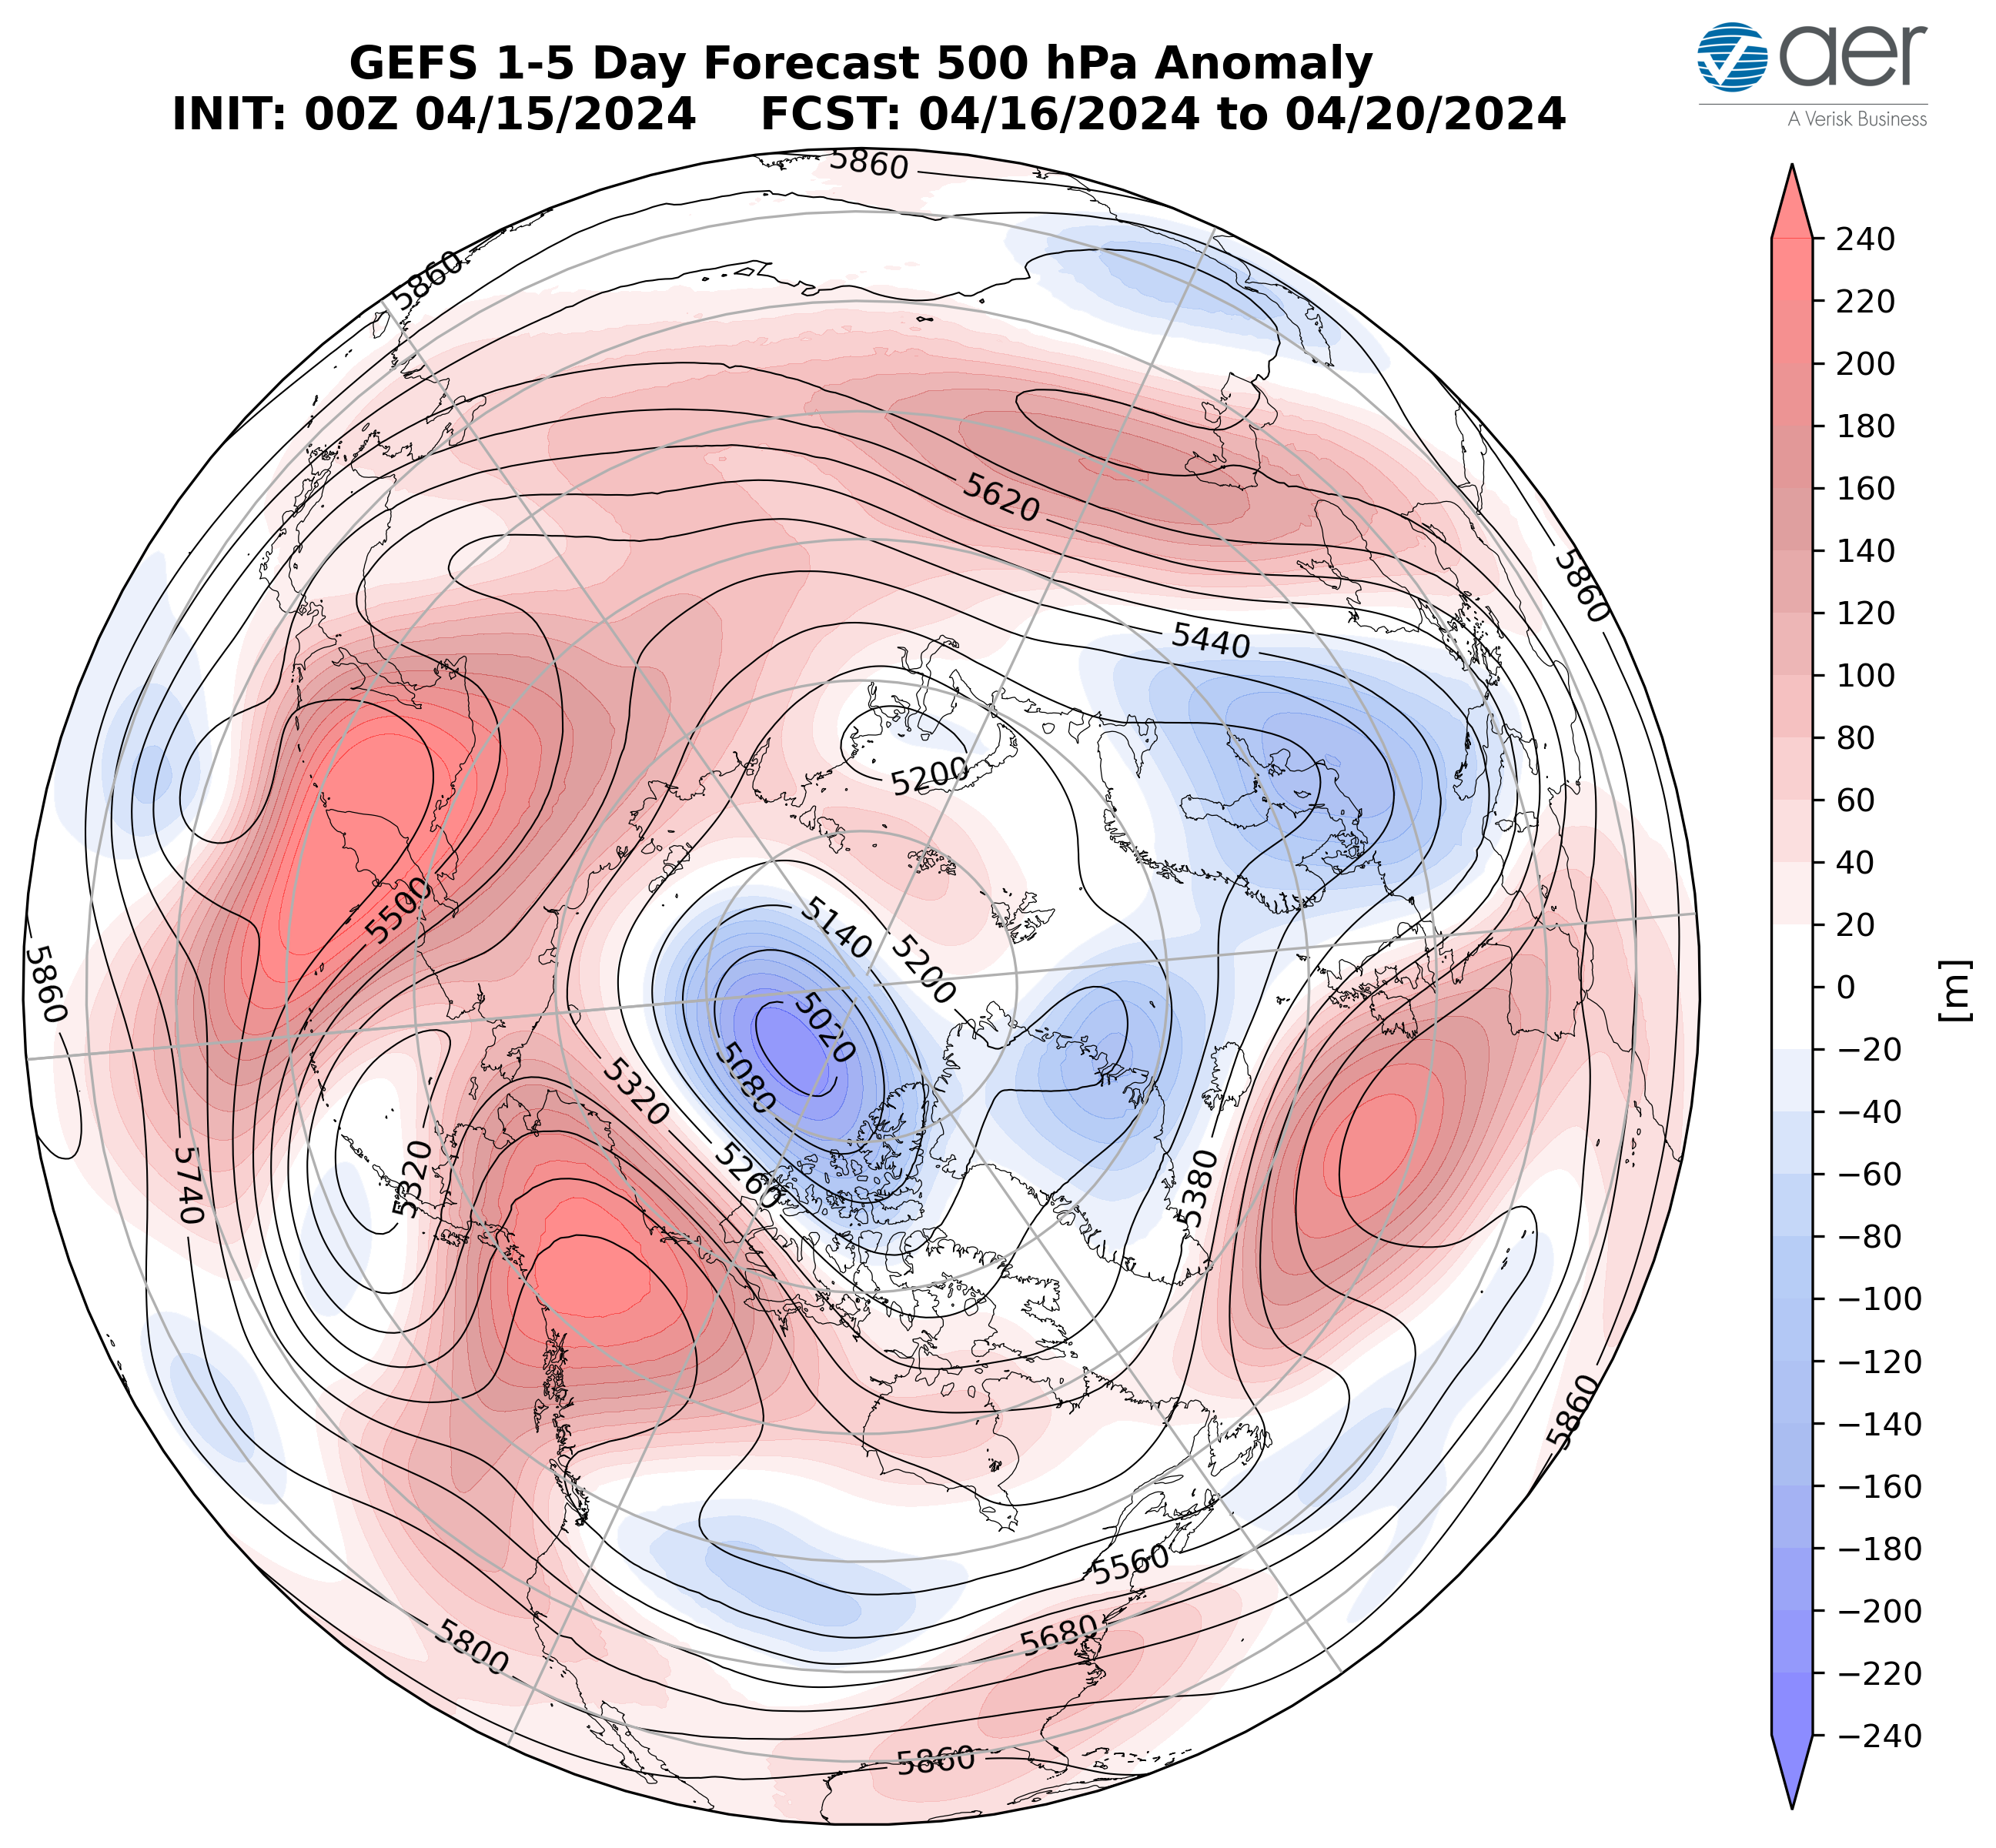
Figure 2. Forecasted average 500 mb geopotential heights (dam; contours) and geopotential height anomalies (m; shading) across the Northern Hemisphere from 16 – 20 April 2024. The forecasts are from the 00z 15 April 2024 2024 GFS ensemble.
The pattern this week across North America is ridging/positive geopotential height anomalies across Alaska and the west coast of North America forcing troughing/negative geopotential height anomalies across Central Canada and the Northcentral US with more ridging/positive geopotential height anomalies across the Eastern US (Figure 2). This pattern will favor normal to above normal temperatures across Alaska, Western and Eastern Canada and the Western, Southern, and Eastern US with normal to below normal temperatures across the Plains of Canada and the Northcentral US (Figure 3).
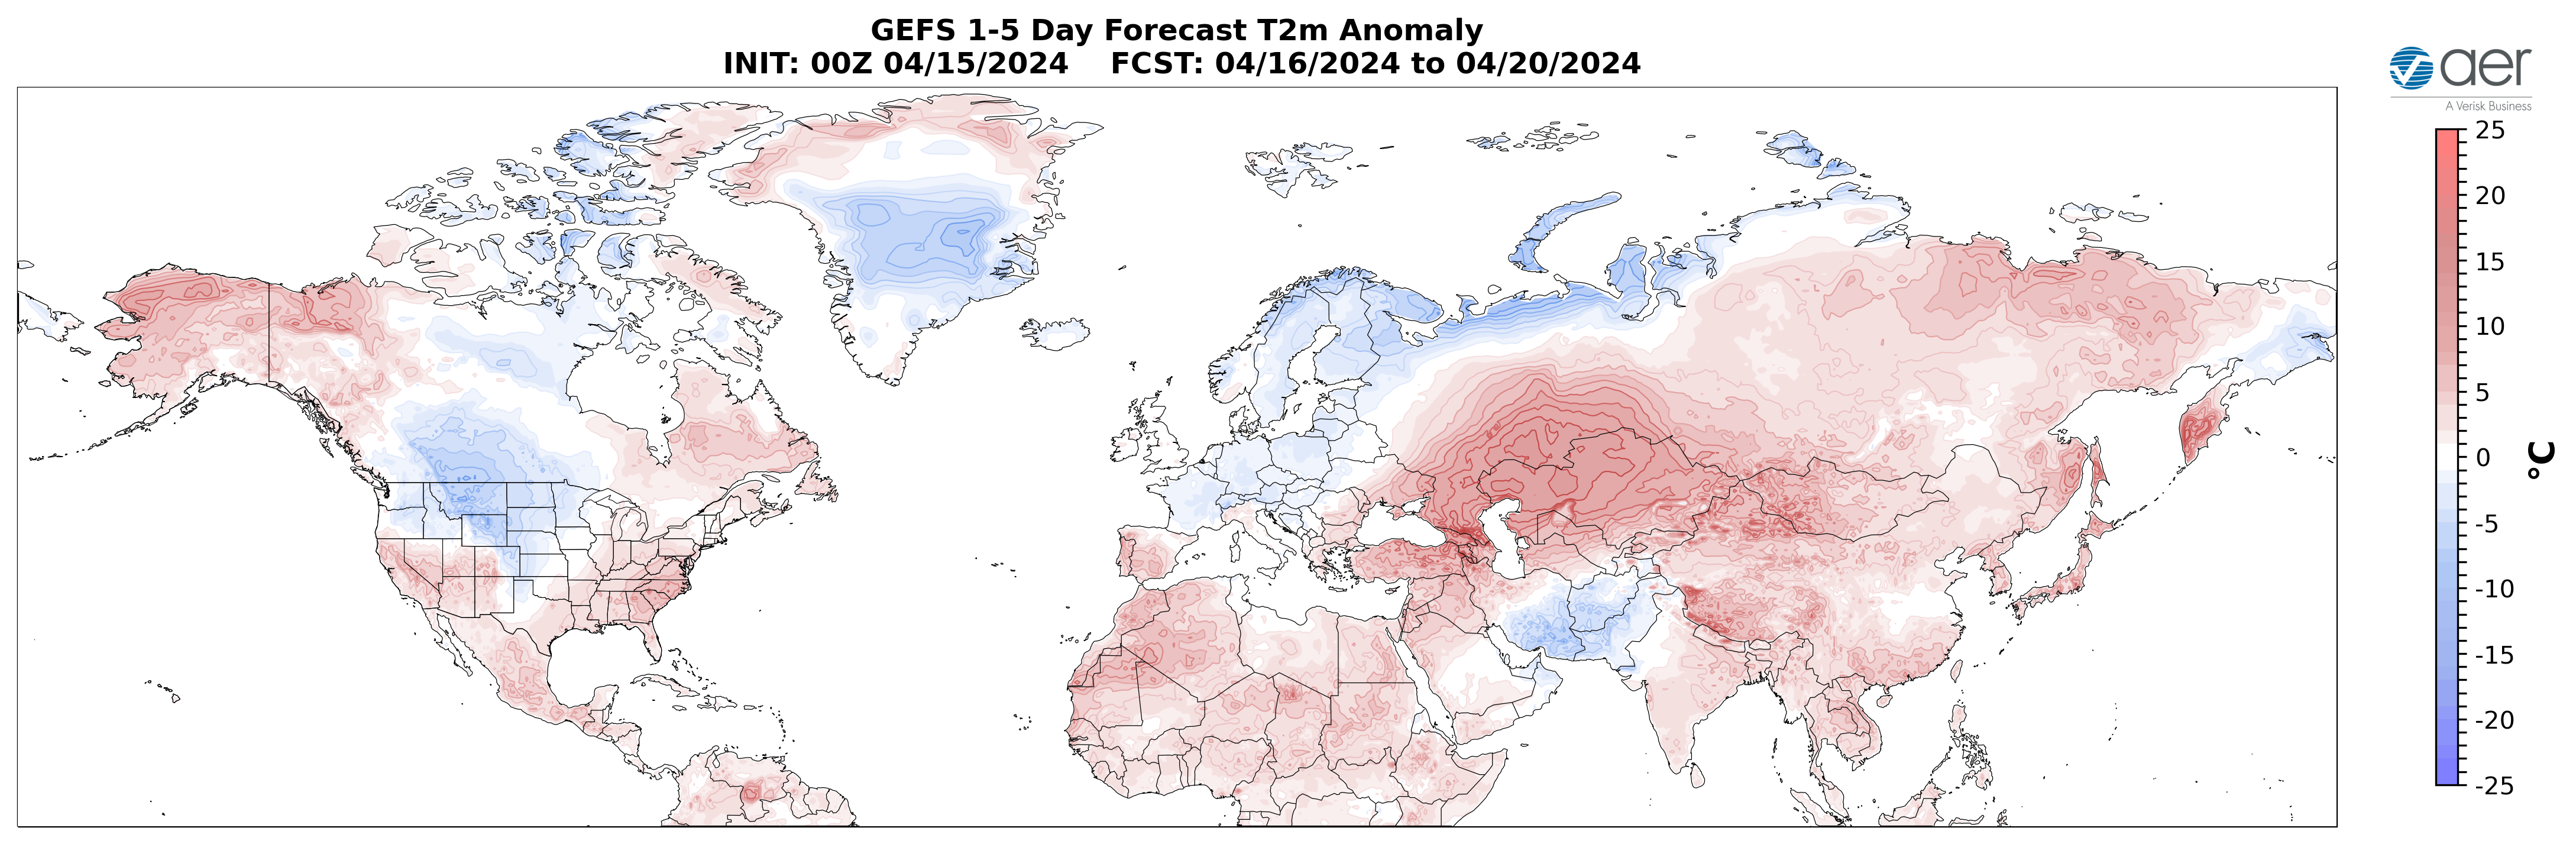
Figure 3. Forecasted surface temperature anomalies (°C; shading) from 16 – 20 April 2024. The forecast is from the 00Z 15 April 2024 2024 GFS ensemble.
Troughing will support above normal rainfall across the Northern and Western Europe, in the Black and Caspian Seas region and Southeast Asia with normal to dry rainfall elsewhere across Eurasia this week (Figure 4). Troughing will support will support above normal rainfall across Southeastern Alaska, the West and East coasts of Canada and the US normal to dry rainfall across the interior of North America this week (Figure 4).
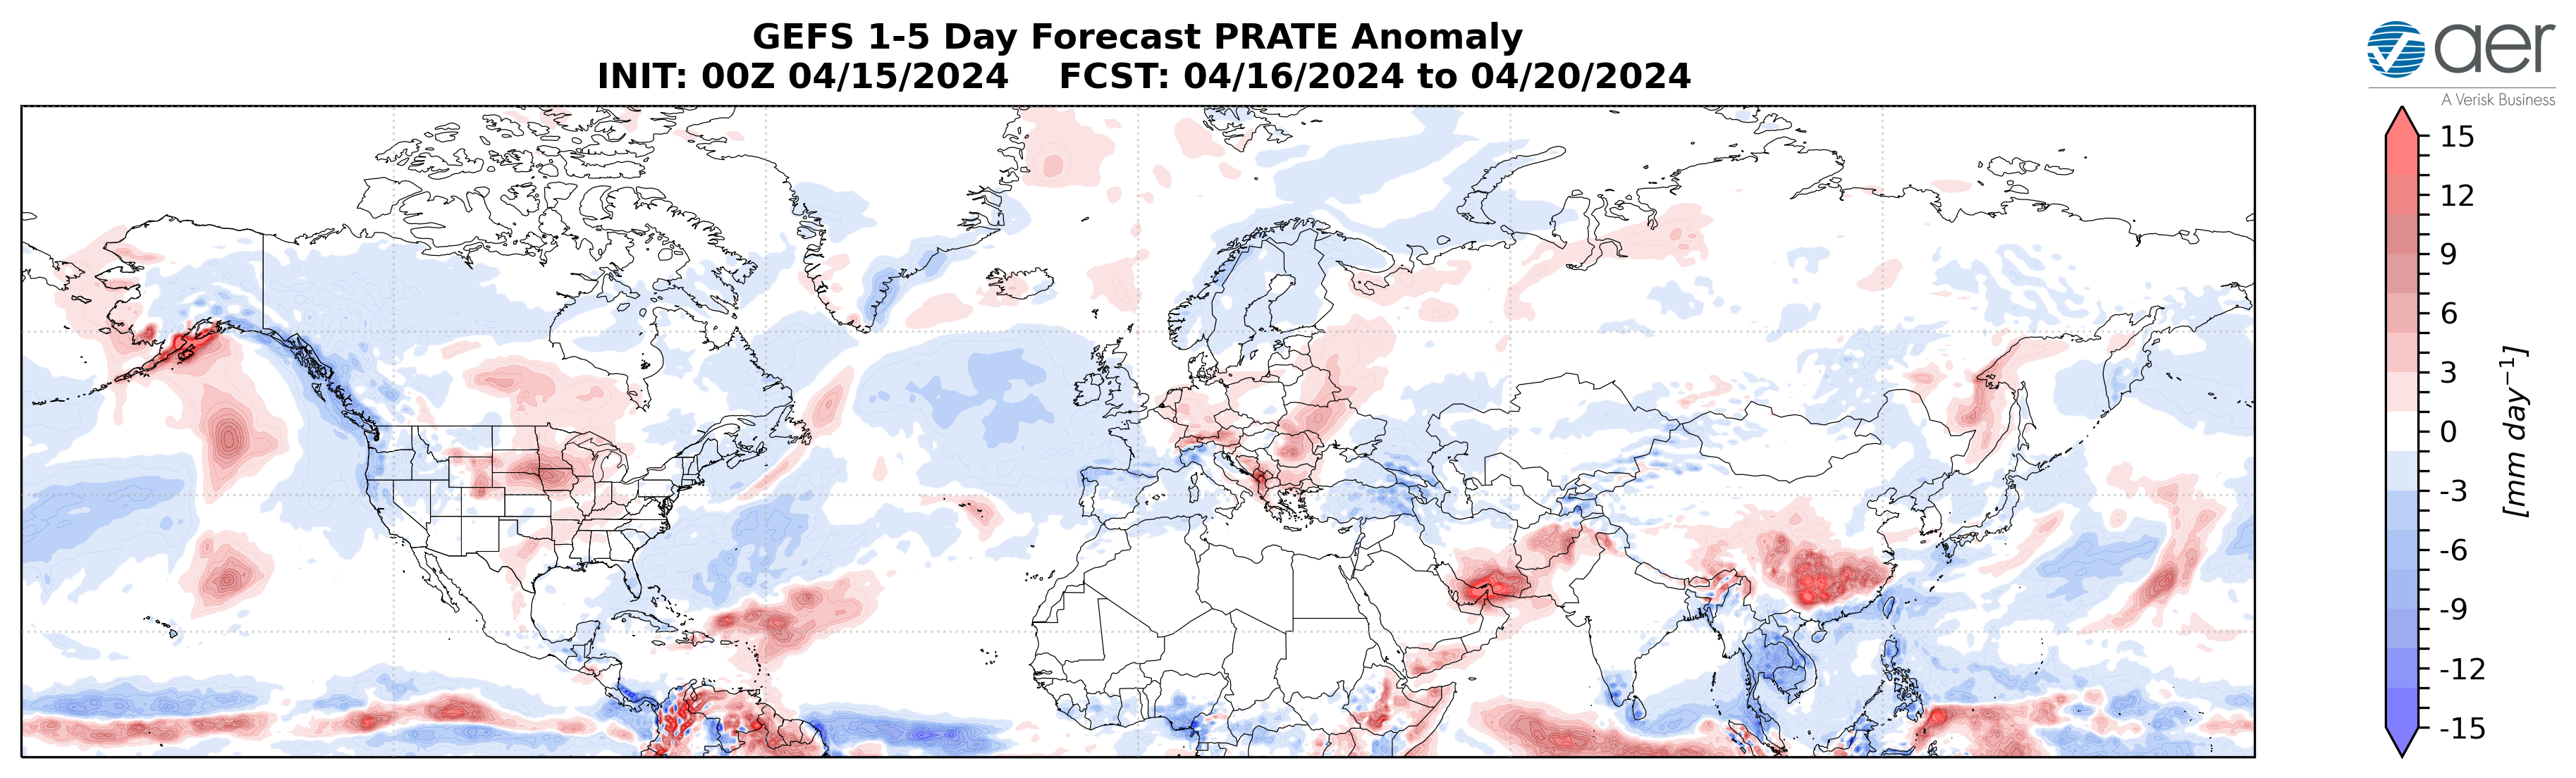
Figure 4. Forecasted precipitation anomalies (mm/day; shading) from 16 – 20 April 2024. The forecast is from the 00Z 15 April 2024 2024 GFS ensemble.
Near-Mid Term
Next week
With geopotential height anomalies turning more mixed across the Arctic and with mixed geopotential height anomalies across the mid-latitudes this period (Figure 5), the AO will likely remain close to neutral this period (Figure 1). With postive pressure/geopotential height anomalies across Greenland strengthening (Figure 5), the NAO will be neutral to slightly negative this period.
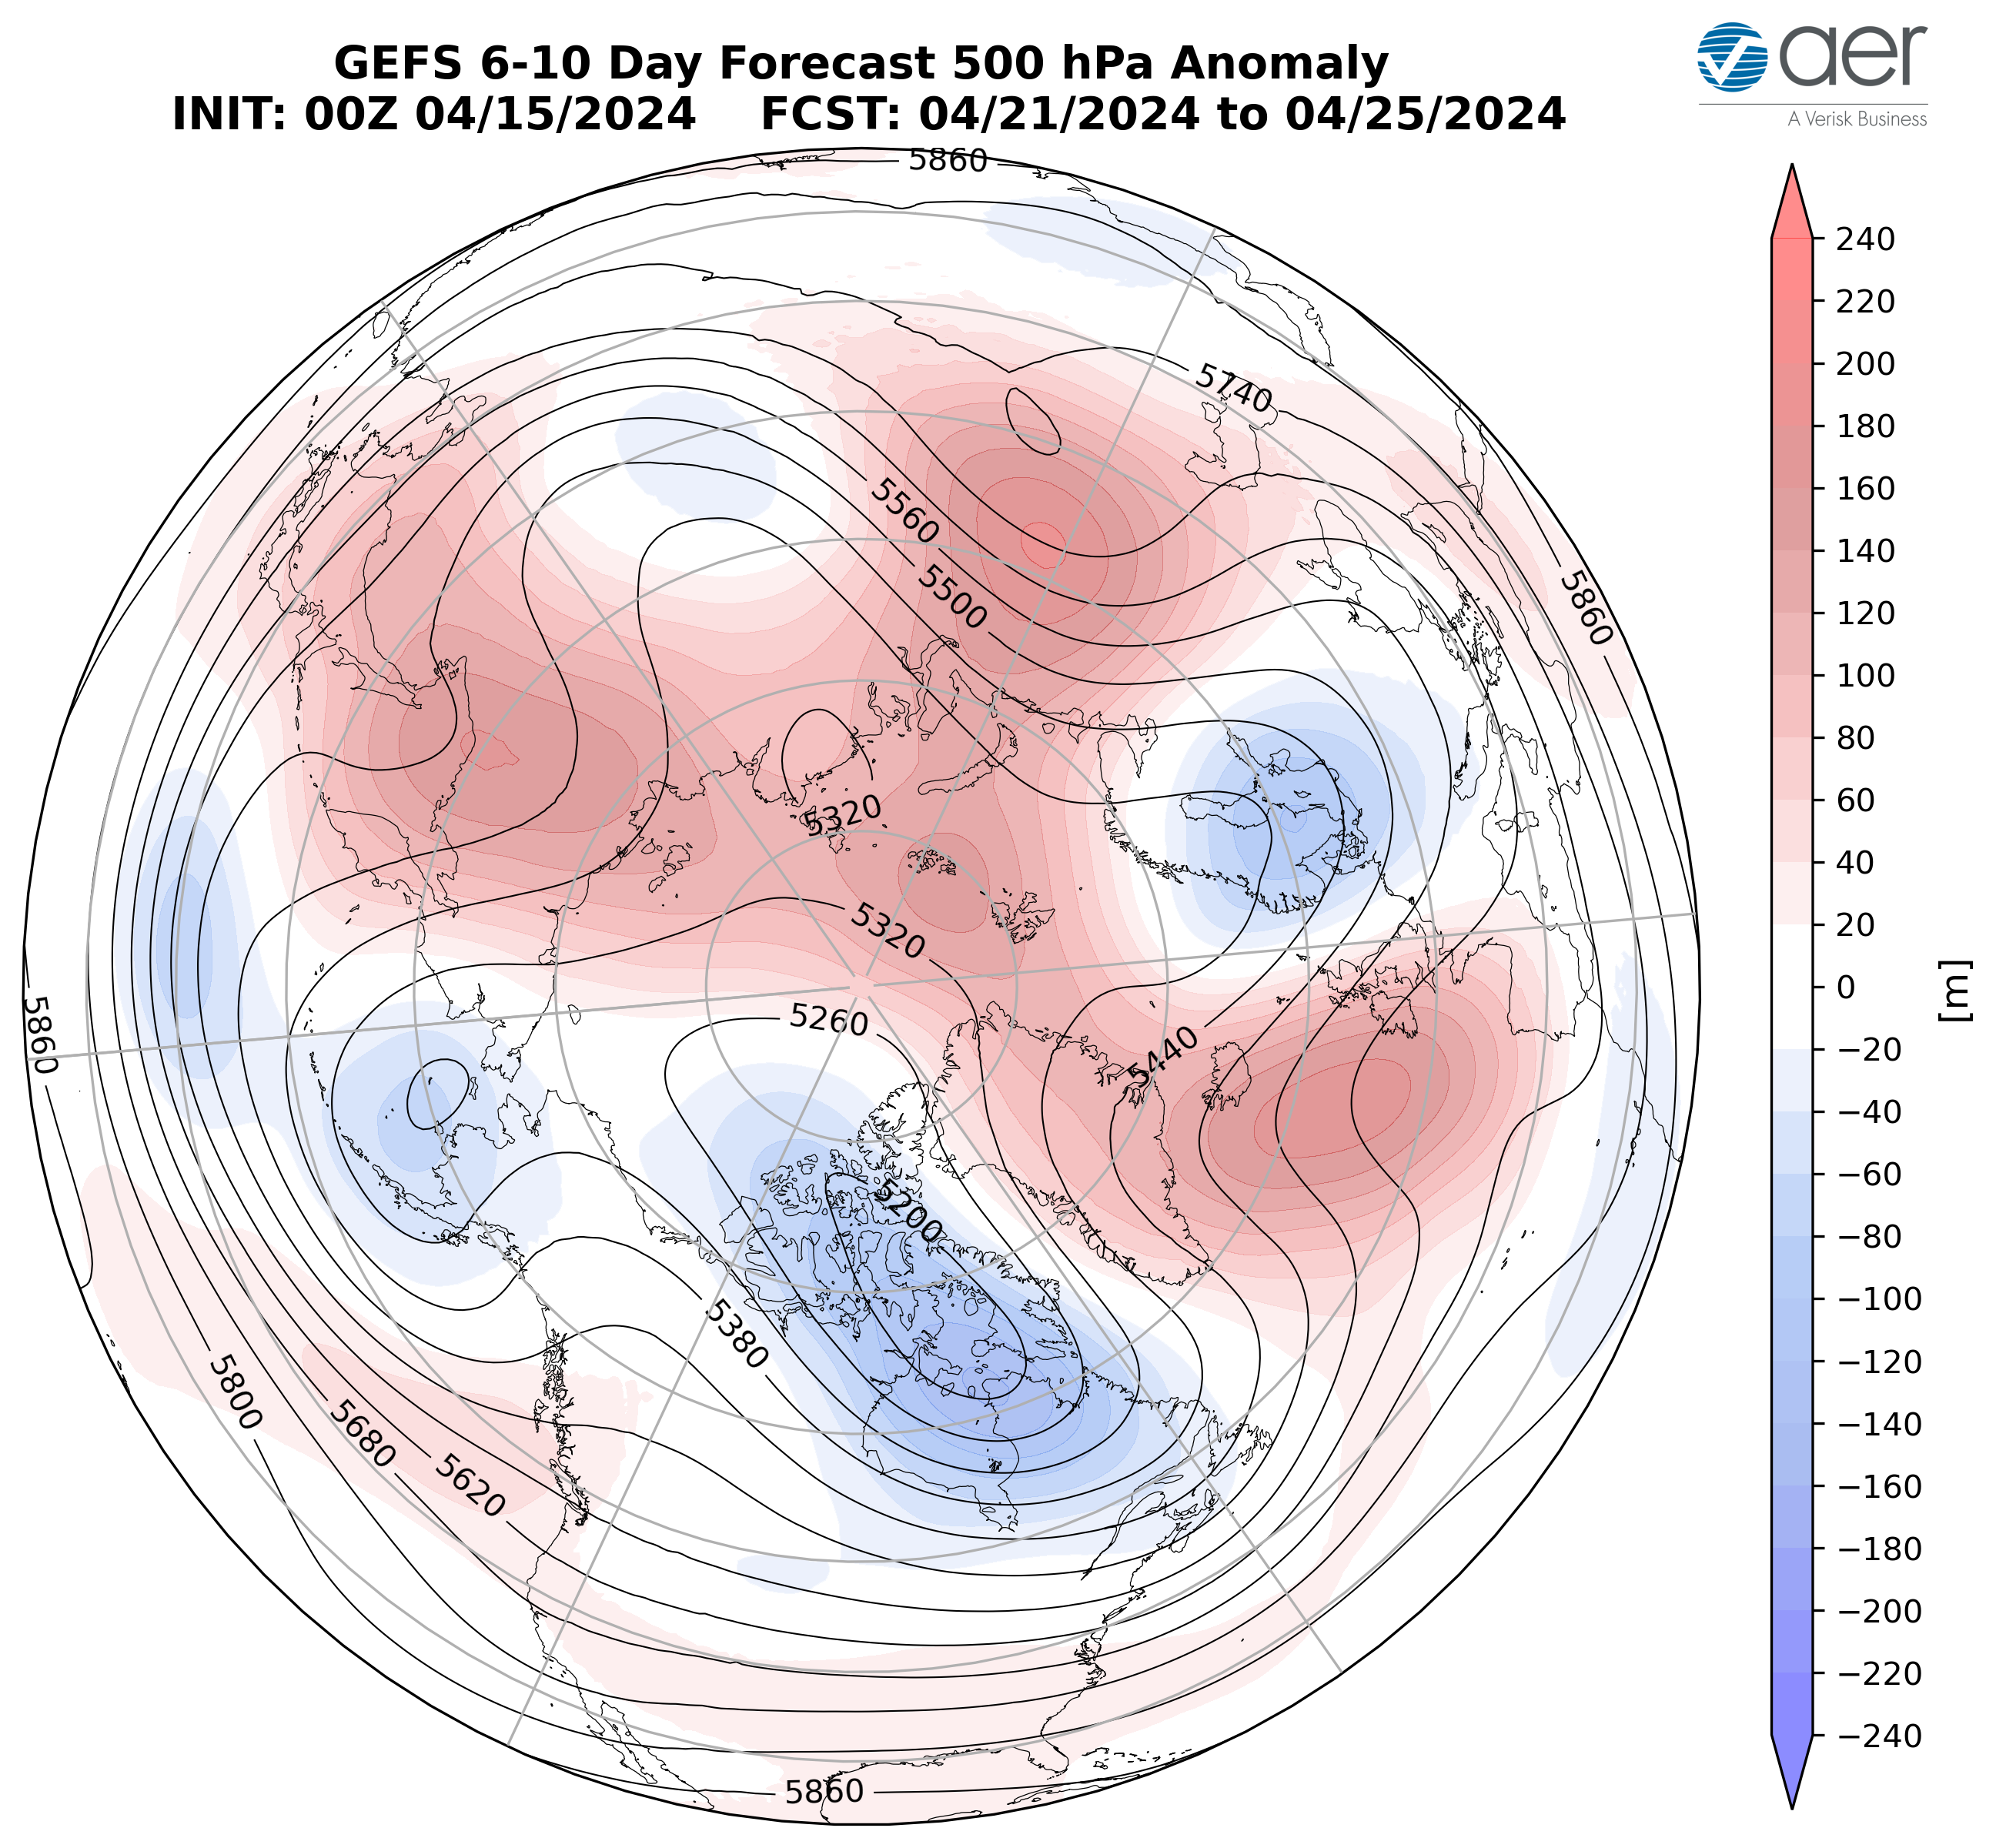
Figure 5. Forecasted average 500 mb geopotential heights (dam; contours) and geopotential height anomalies (m; shading) across the Northern Hemisphere from 21 – 25 April 2024. The forecasts are from the 00z 15 April 2024 2024 GFS ensemble.
Strengthening ridging/positive geopotential height anomalies across Greenland will support troughing/negative geopotential height anomalies across much Europe with more ridging/positive geopotential height anomalies across far Western and Southeastern Europe this period (Figure 5). This pattern will favor normal to above normal temperatures across much of Europe including the UK with normal to below normal temperatures limited to the Iberian Peninsula and the Balkans/Turkey (Figures 6). Ridging/positive geopotential height anomalies are predicted to dominate both Western and Eastern Asia with troughing/negative geopotential height anomalies across Central Asia this period (Figure 5). This pattern favors widespread normal to above normal temperatures across much of Asia with the exception of normal to below normal temperatures limited to Northwestern Siberia and the northern Urals this period (Figure 6).
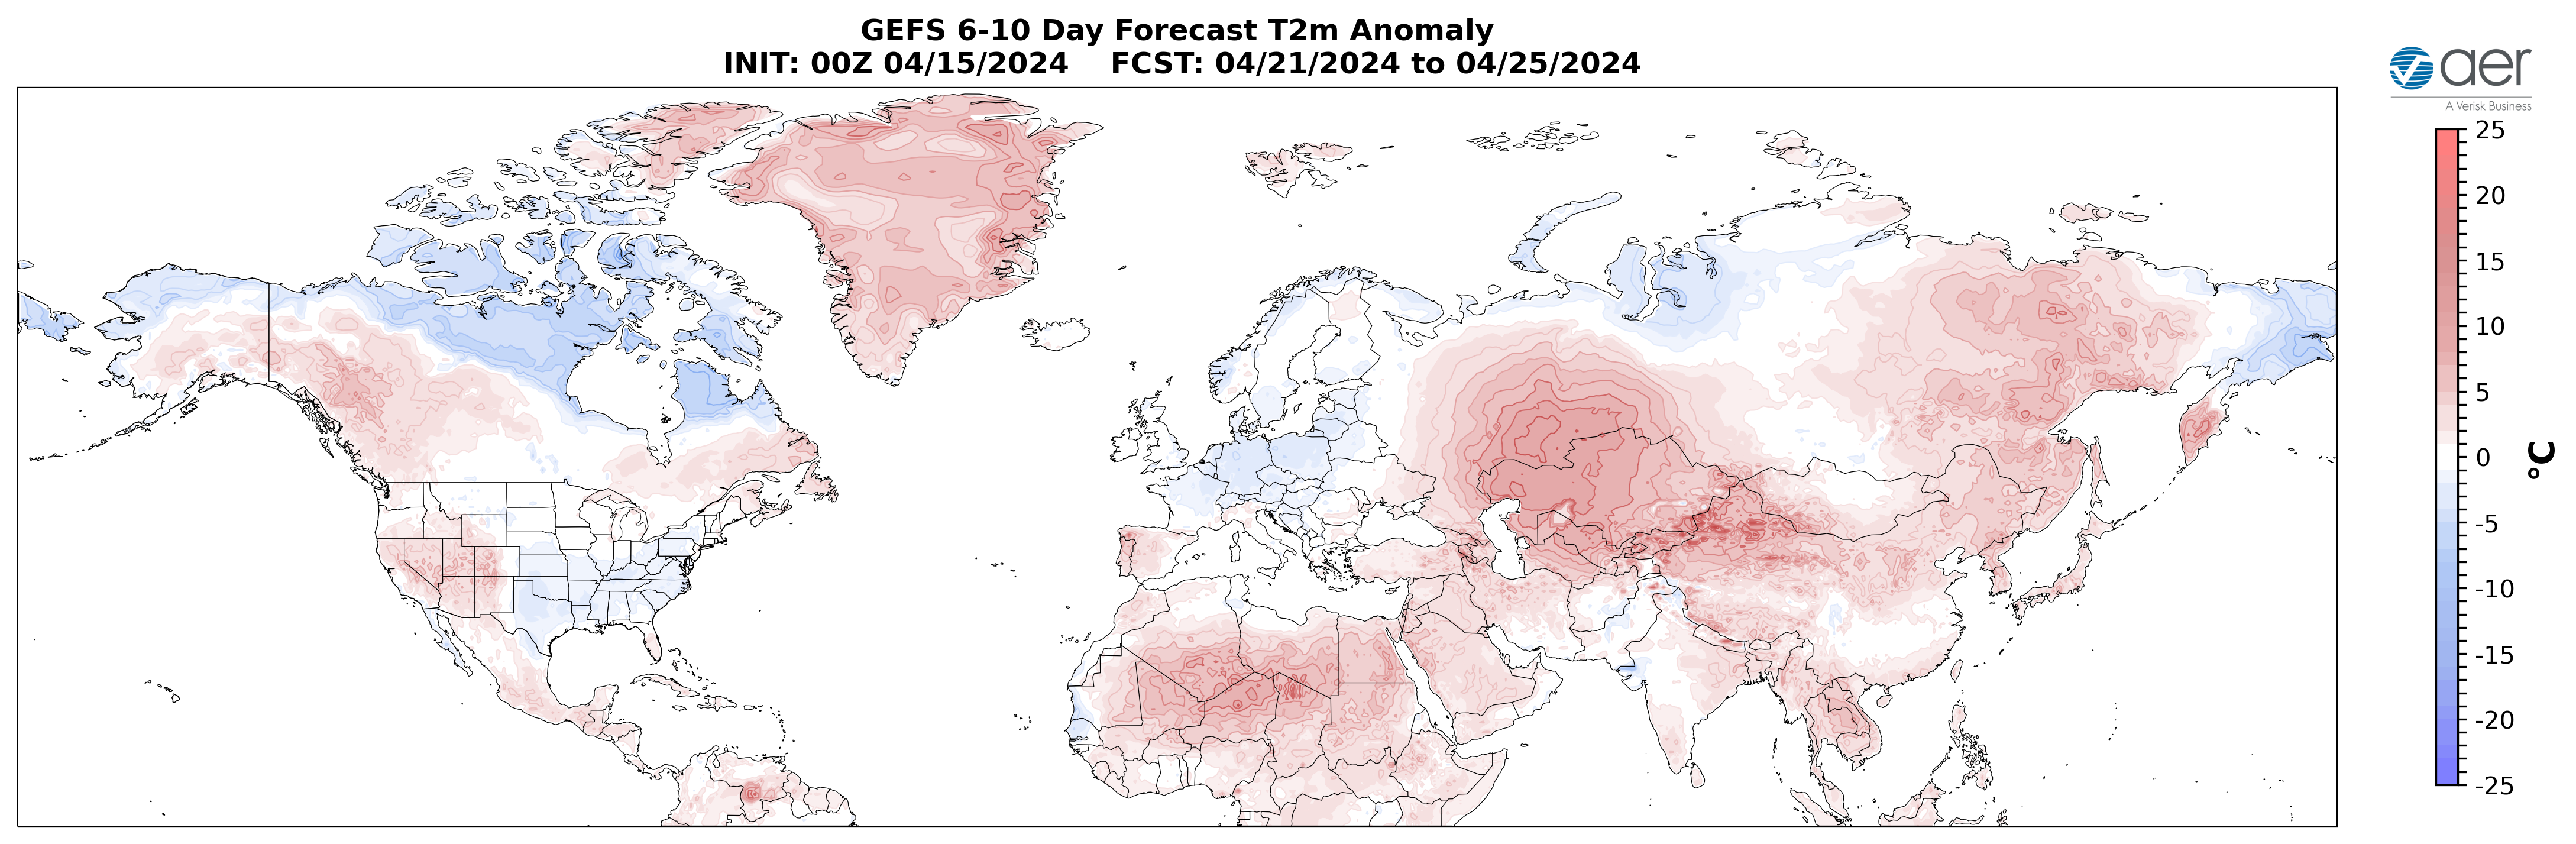
Figure 6. Forecasted surface temperature anomalies (°C; shading) from 21 – 25 April 2024. The forecasts are from the 00z 15 April 2024 2024 GFS ensemble.
Persistent ridging/positive geopotential height anomalies across Alaska, the Gulf of Alaska and the West Coasts of Canada and the US will support troughing/negative geopotential height anomalies across Eastern Canada and the Eastern US this period (Figure 5). This pattern favors widespread normal to above normal temperatures across Alaska, Western Canada and the Western US with normal to below normal temperatures across Eastern Canada and the Eastern US (Figure 6).
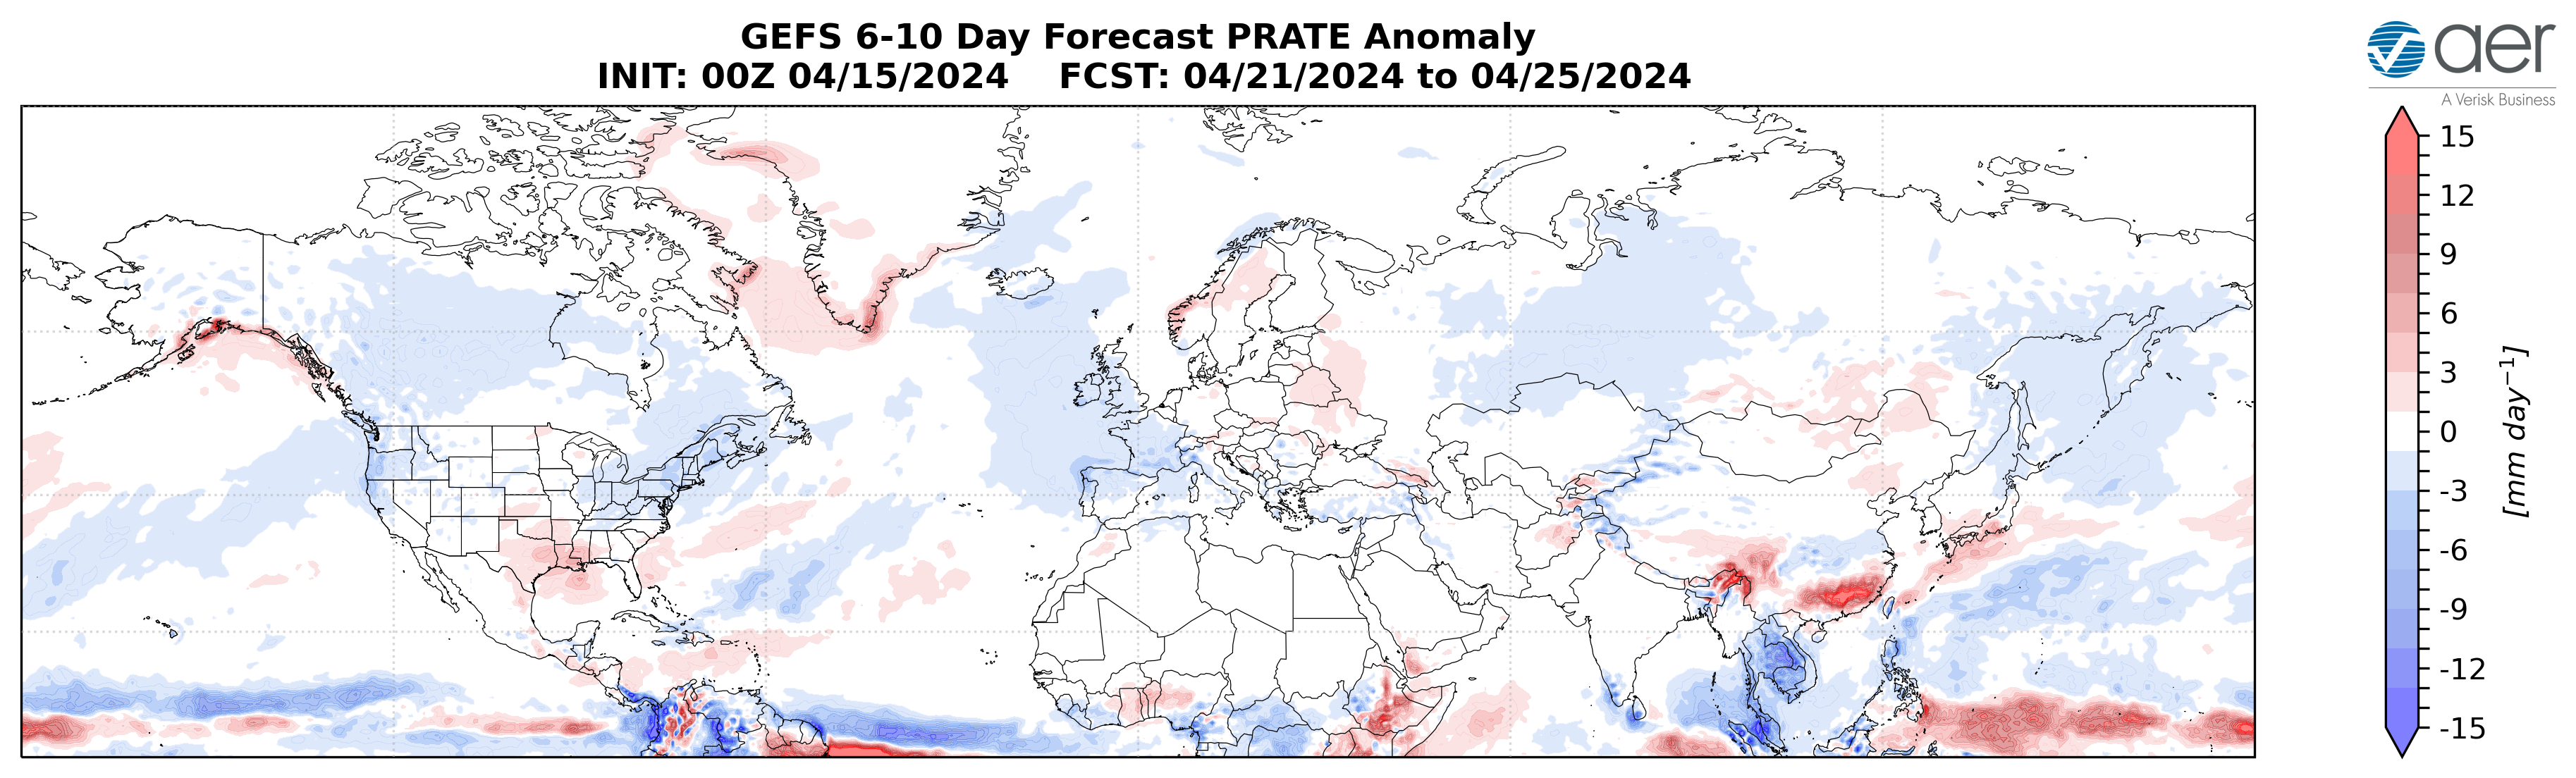
Figure 7. Forecasted snow depth changes (mm/day; shading) from 21 – 25 April 2024. The forecast is from the 00Z 15 April 2024 2024 GFS ensemble.
Troughing will support above normal rainfall across the Eastern Europe and Southeast Asia with normal to dry rainfall elsewhere across Eurasia this period (Figure 7). Troughing will support above normal rainfall along the Gulf of Mexico with normal to dry rainfall across much of North America this period (Figure 7).
Mid Term
Week Two
With predicted mostly mixed to positive geopotential height anomalies across the Arctic and mixed geopotential height anomalies across the mid-latitudes this period (Figure 8), the AO will likely be neutral to negative this period (Figure 1). With predicted positive pressure/geopotential height anomalies across Greenland (Figure 8), the NAO should be negative this period.
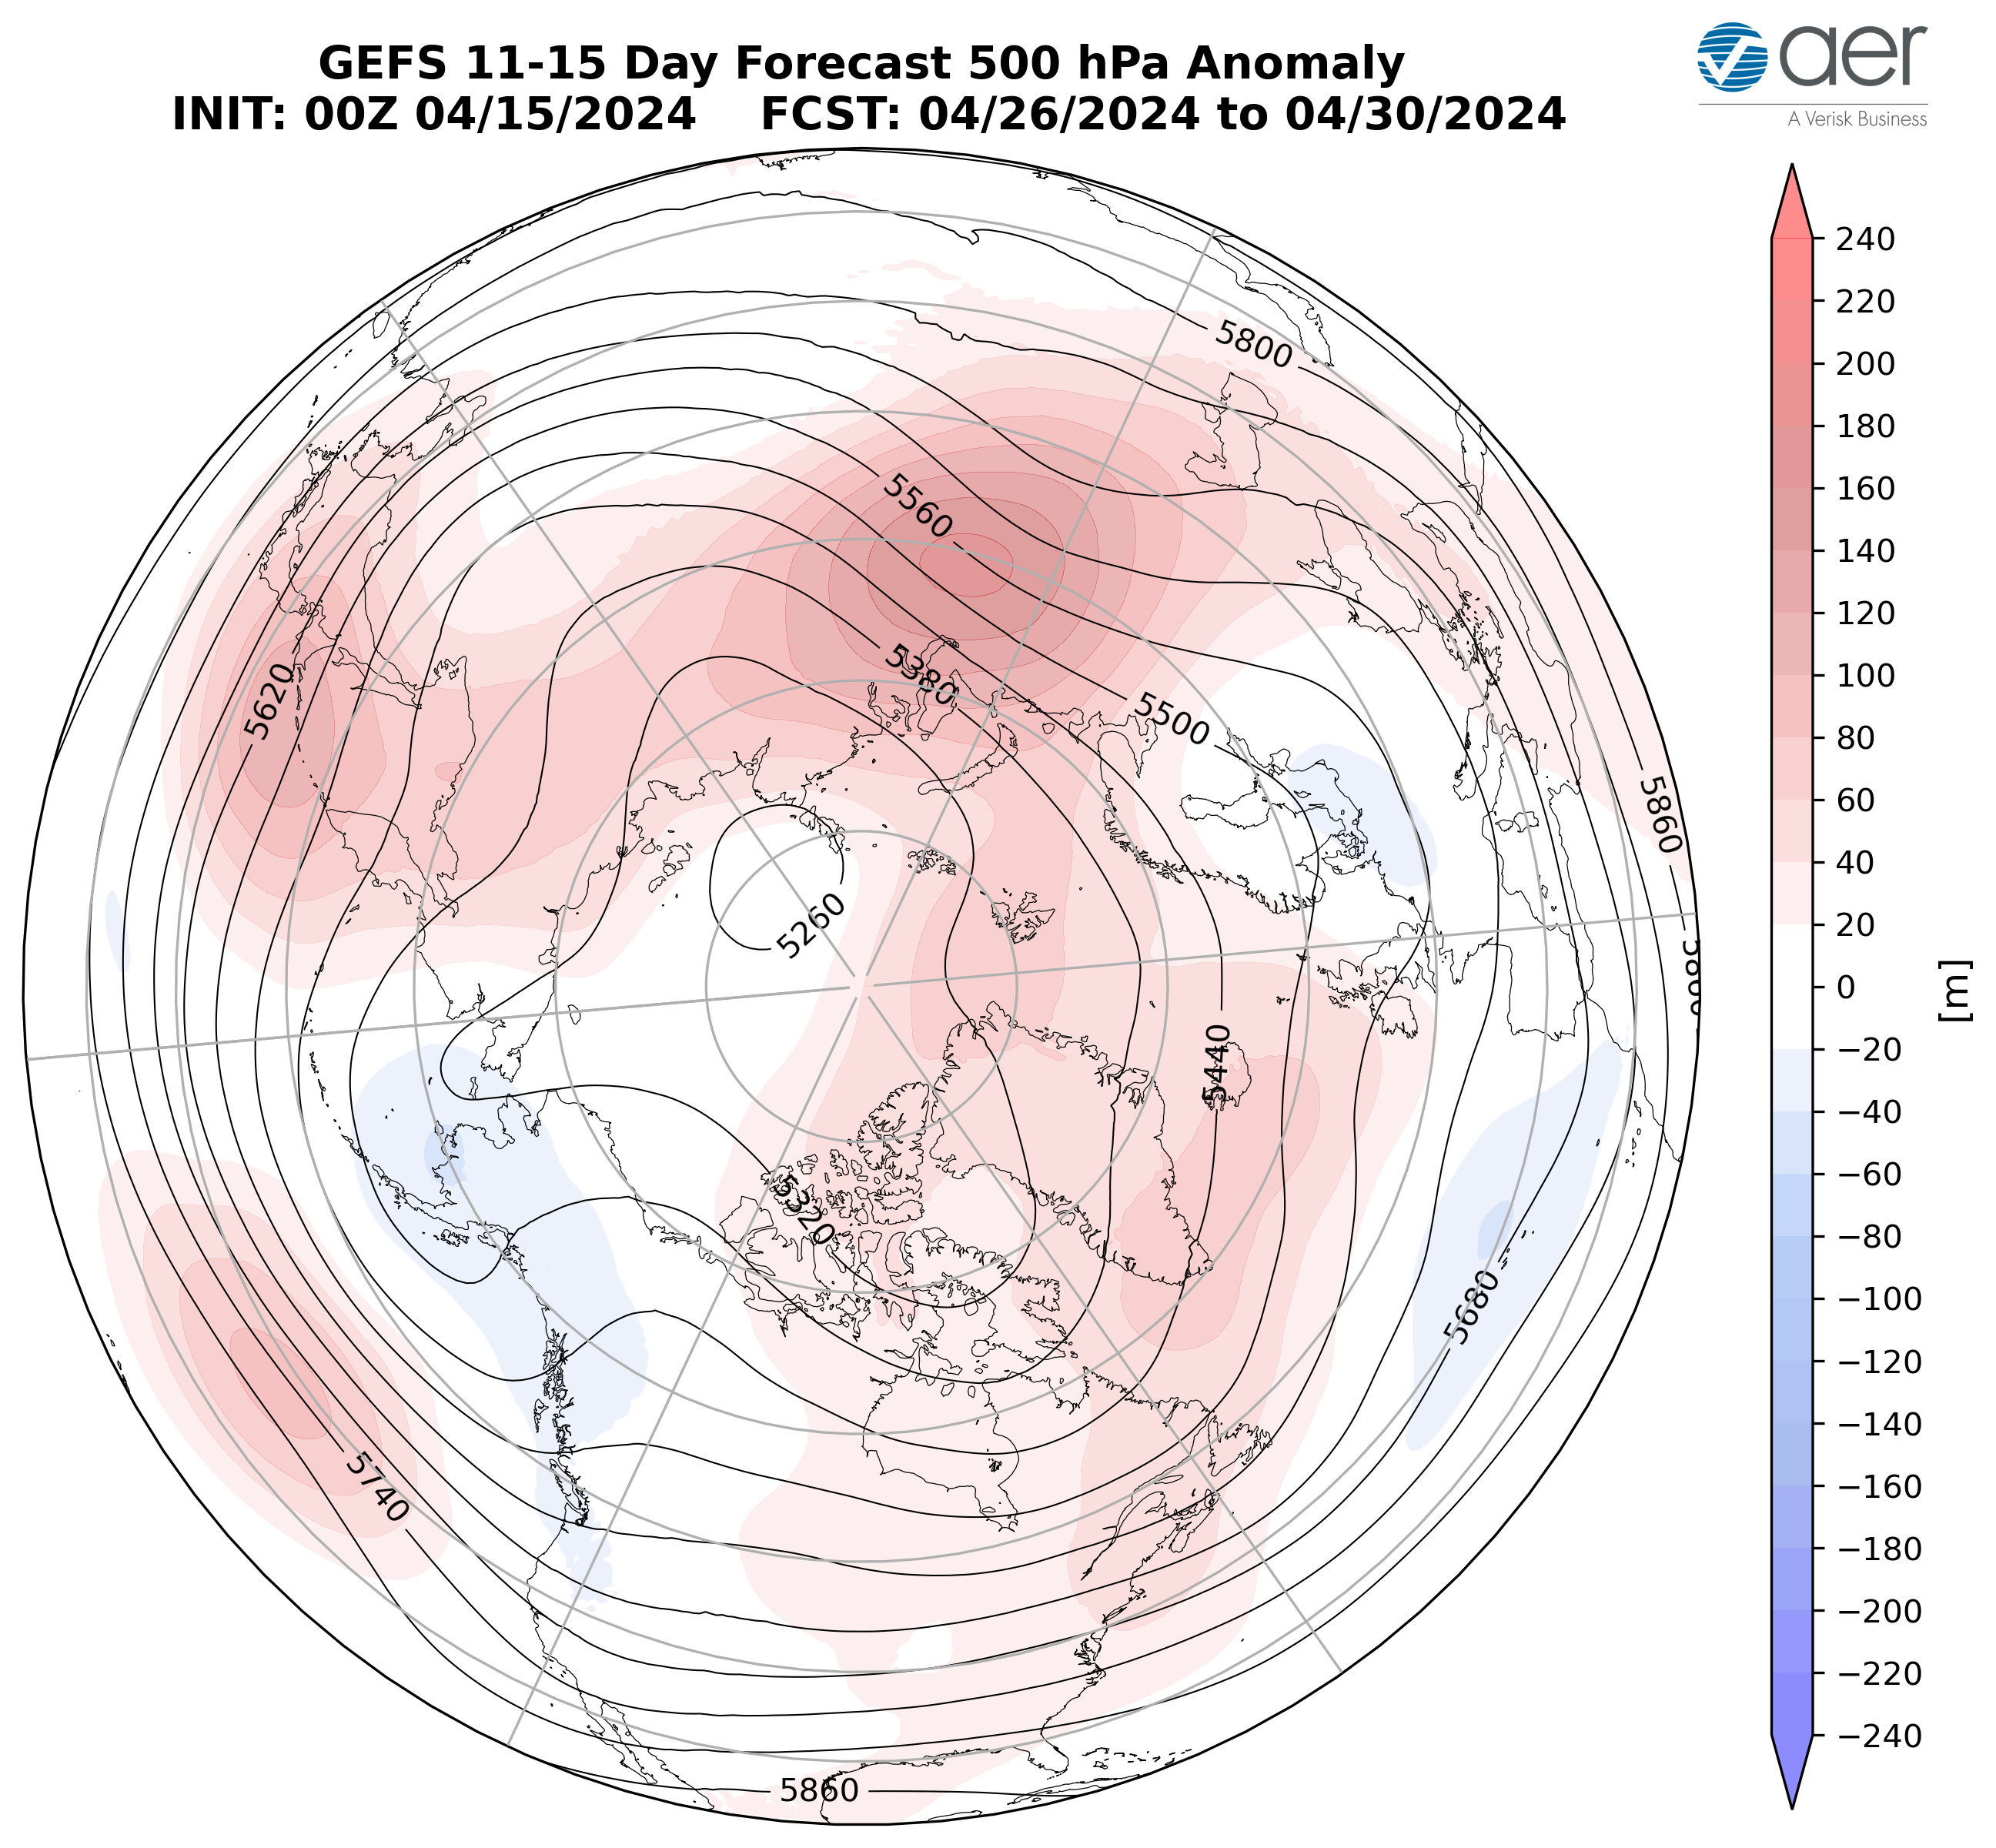
Figure 8. Forecasted average 500 mb geopotential heights (dam; contours) and geopotential height anomalies (m; shading) across the Northern Hemisphere from 26 – 30 April 2024. The forecasts are from the 00z 15 April 2024 2024 GFS ensemble.
As ridging/positive geopotential height anomalies across Greenland will continue to support troughing/negative geopotential height anomalies across Northern and Western Europe with more ridging/positive geopotential height anomalies across Southeastern Europe this period (Figure 8). This pattern should favor normal to below normal temperatures across Northwestern Europe including the UK with normal to above normal temperatures across Southern and Eastern Europe this period (Figures 9). Ridging/positive geopotential height anomalies are predicted to be widespread across Asia with the exception of weak troughing/negative geopotential height anomalies across Central Asia this period (Figure 8). The predicted pattern favors widespread normal to above normal temperatures across much of Asia with normal to below normal limited to Mongolia and pockets in Siberia this period (Figure 9).
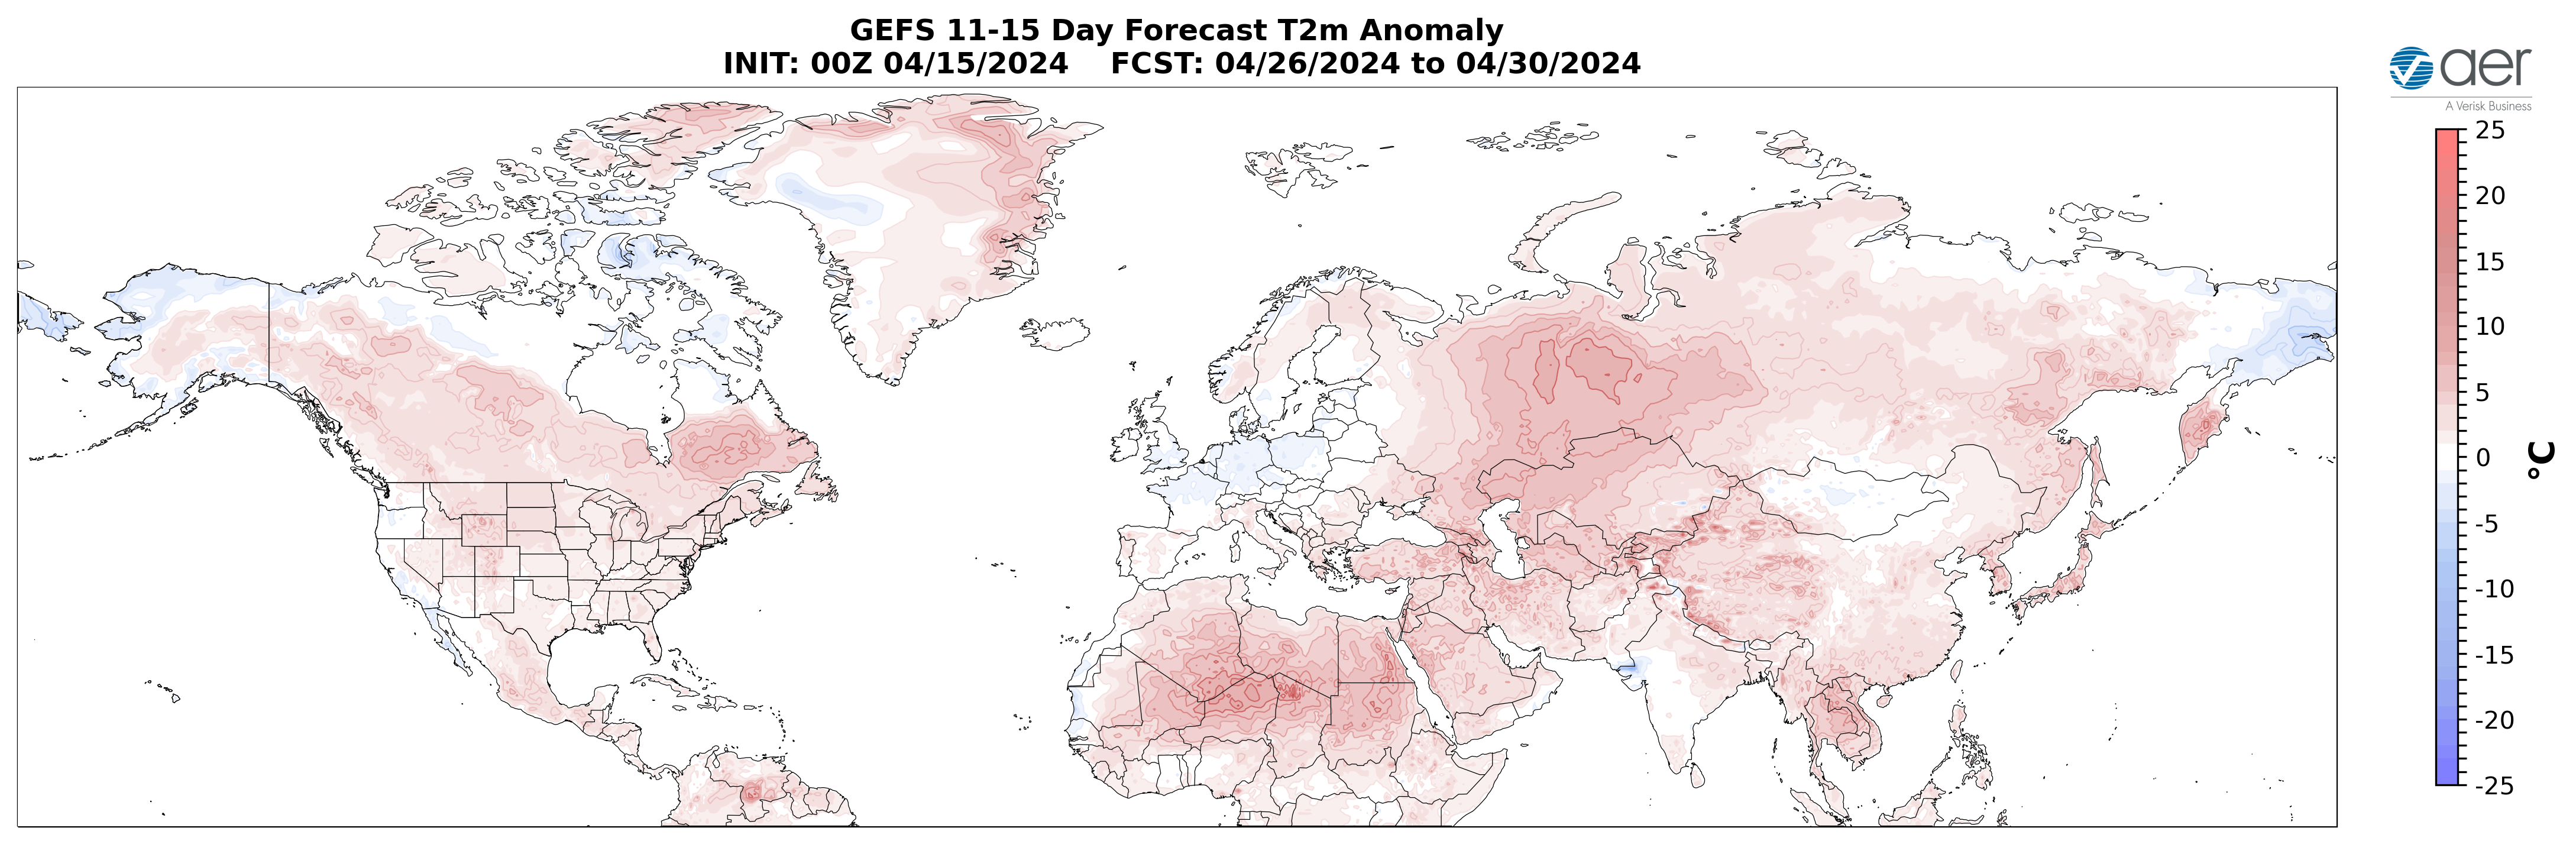
Figure 9. Forecasted surface temperature anomalies (°C; shading) from 26 – 30 April 2024. The forecasts are from the 00z 15 April 2024 2024 GFS ensemble.
Ridging/positive geopotential height anomalies are predicted to dominate North America with the exceptions of troughing/negative geopotential height anomalies across Northern and Eastern Canada and the Southwestern US this period (Figure 8). This pattern favors widespread normal to above normal temperatures across Alaska, Canada and the US with normal to below normal temperatures limited to Northeastern Canada and the Southwestern US this period (Figure 9).
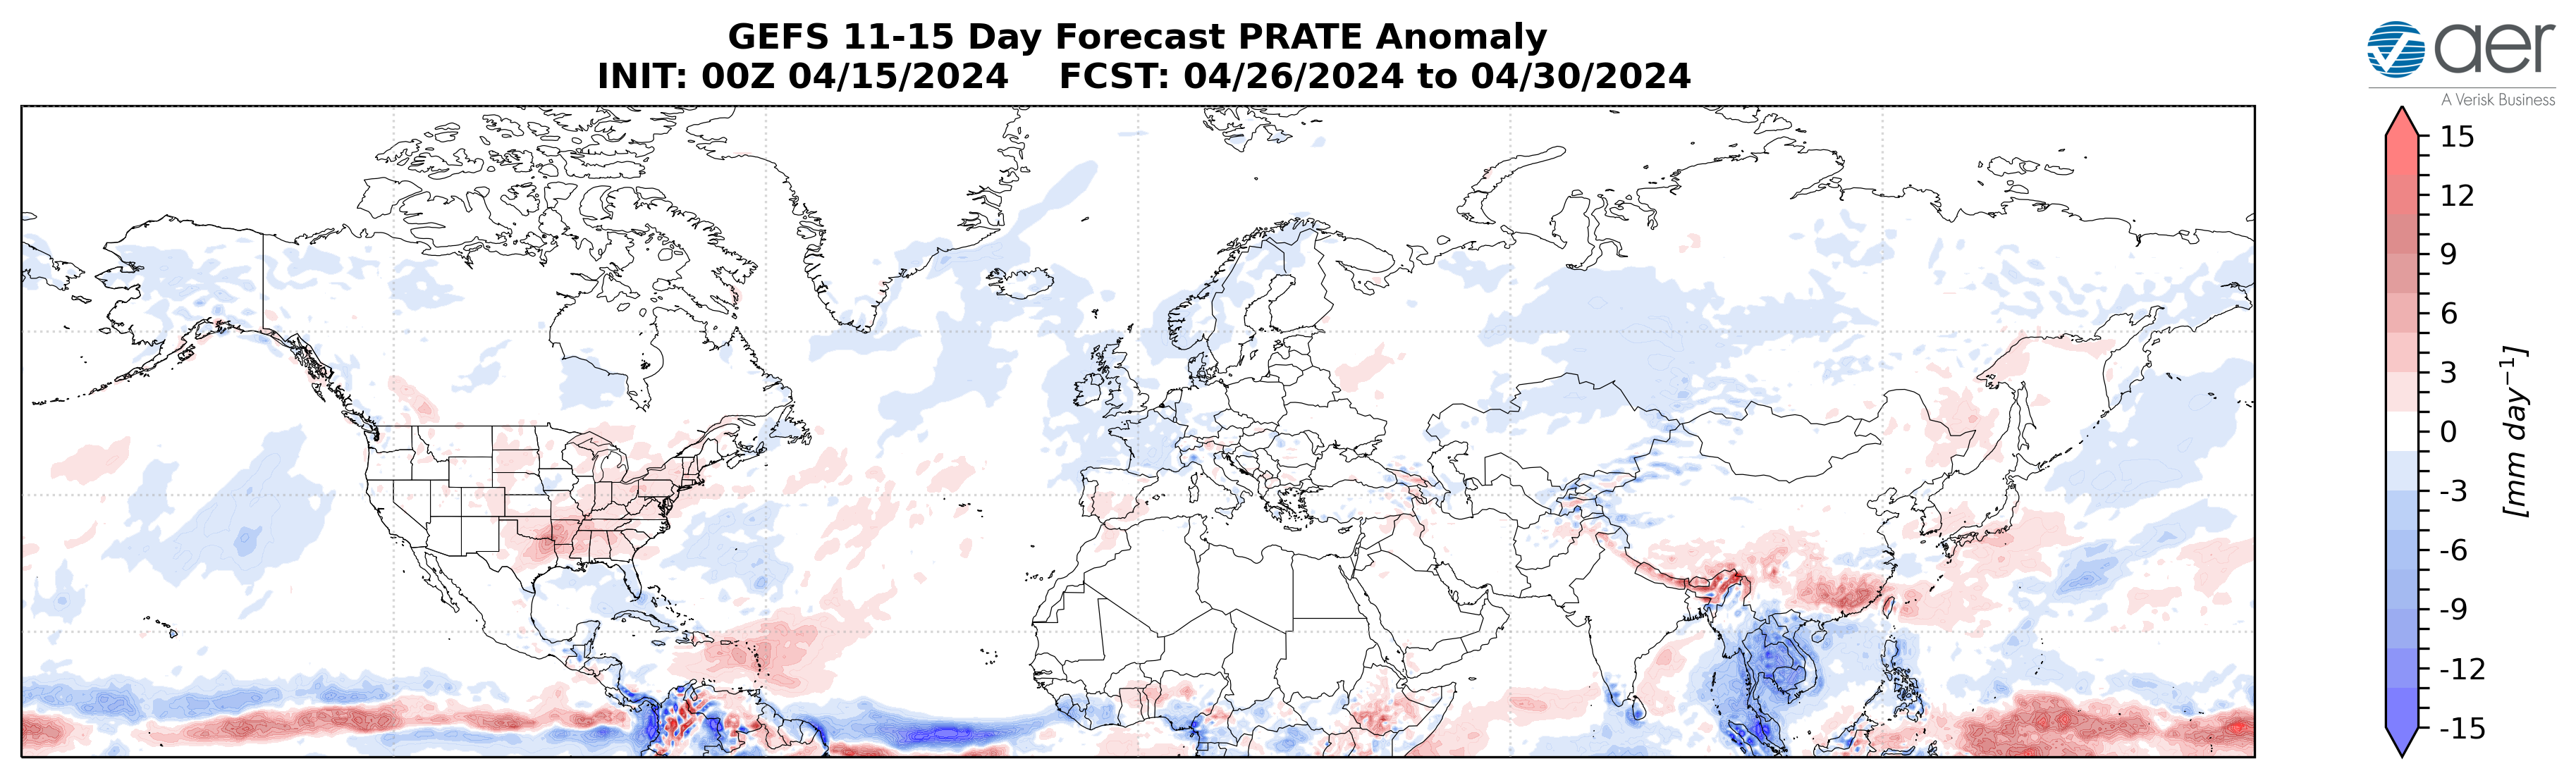
Figure 10. Forecasted snow depth changes (mm/day; shading) from 26 – 30 April 2024. The forecast is from the 00Z 15 April 2024 2024 GFS ensemble.
Troughing will support above normal rainfall across Southeast Asia with normal to dry rainfall elsewhere across Eurasia this period (Figure 10). Troughing will support will support above normal rainfall across the US Rockies and Plains with normal to dry rainfall across the interior of North America this period (Figure 10).
Longer Term
30–day
The latest plot of the polar cap geopotential height anomalies (PCHs) currently shows warm/positive PCHs throughout the lower stratosphere and upper troposphere with cold/negative PCHs in the lower troposphere and cold/negative and upper stratosphere (Figure 11). Then for the next two weeks warm/positive PCHs from the lower stratosphere with propagate down through the troposphere (Figure 11). The descent of the warm/positive PCHs anomalies from the lower stratosphere through the troposphere (Figure 11) are associated with the PV disruption/SSW from early March.
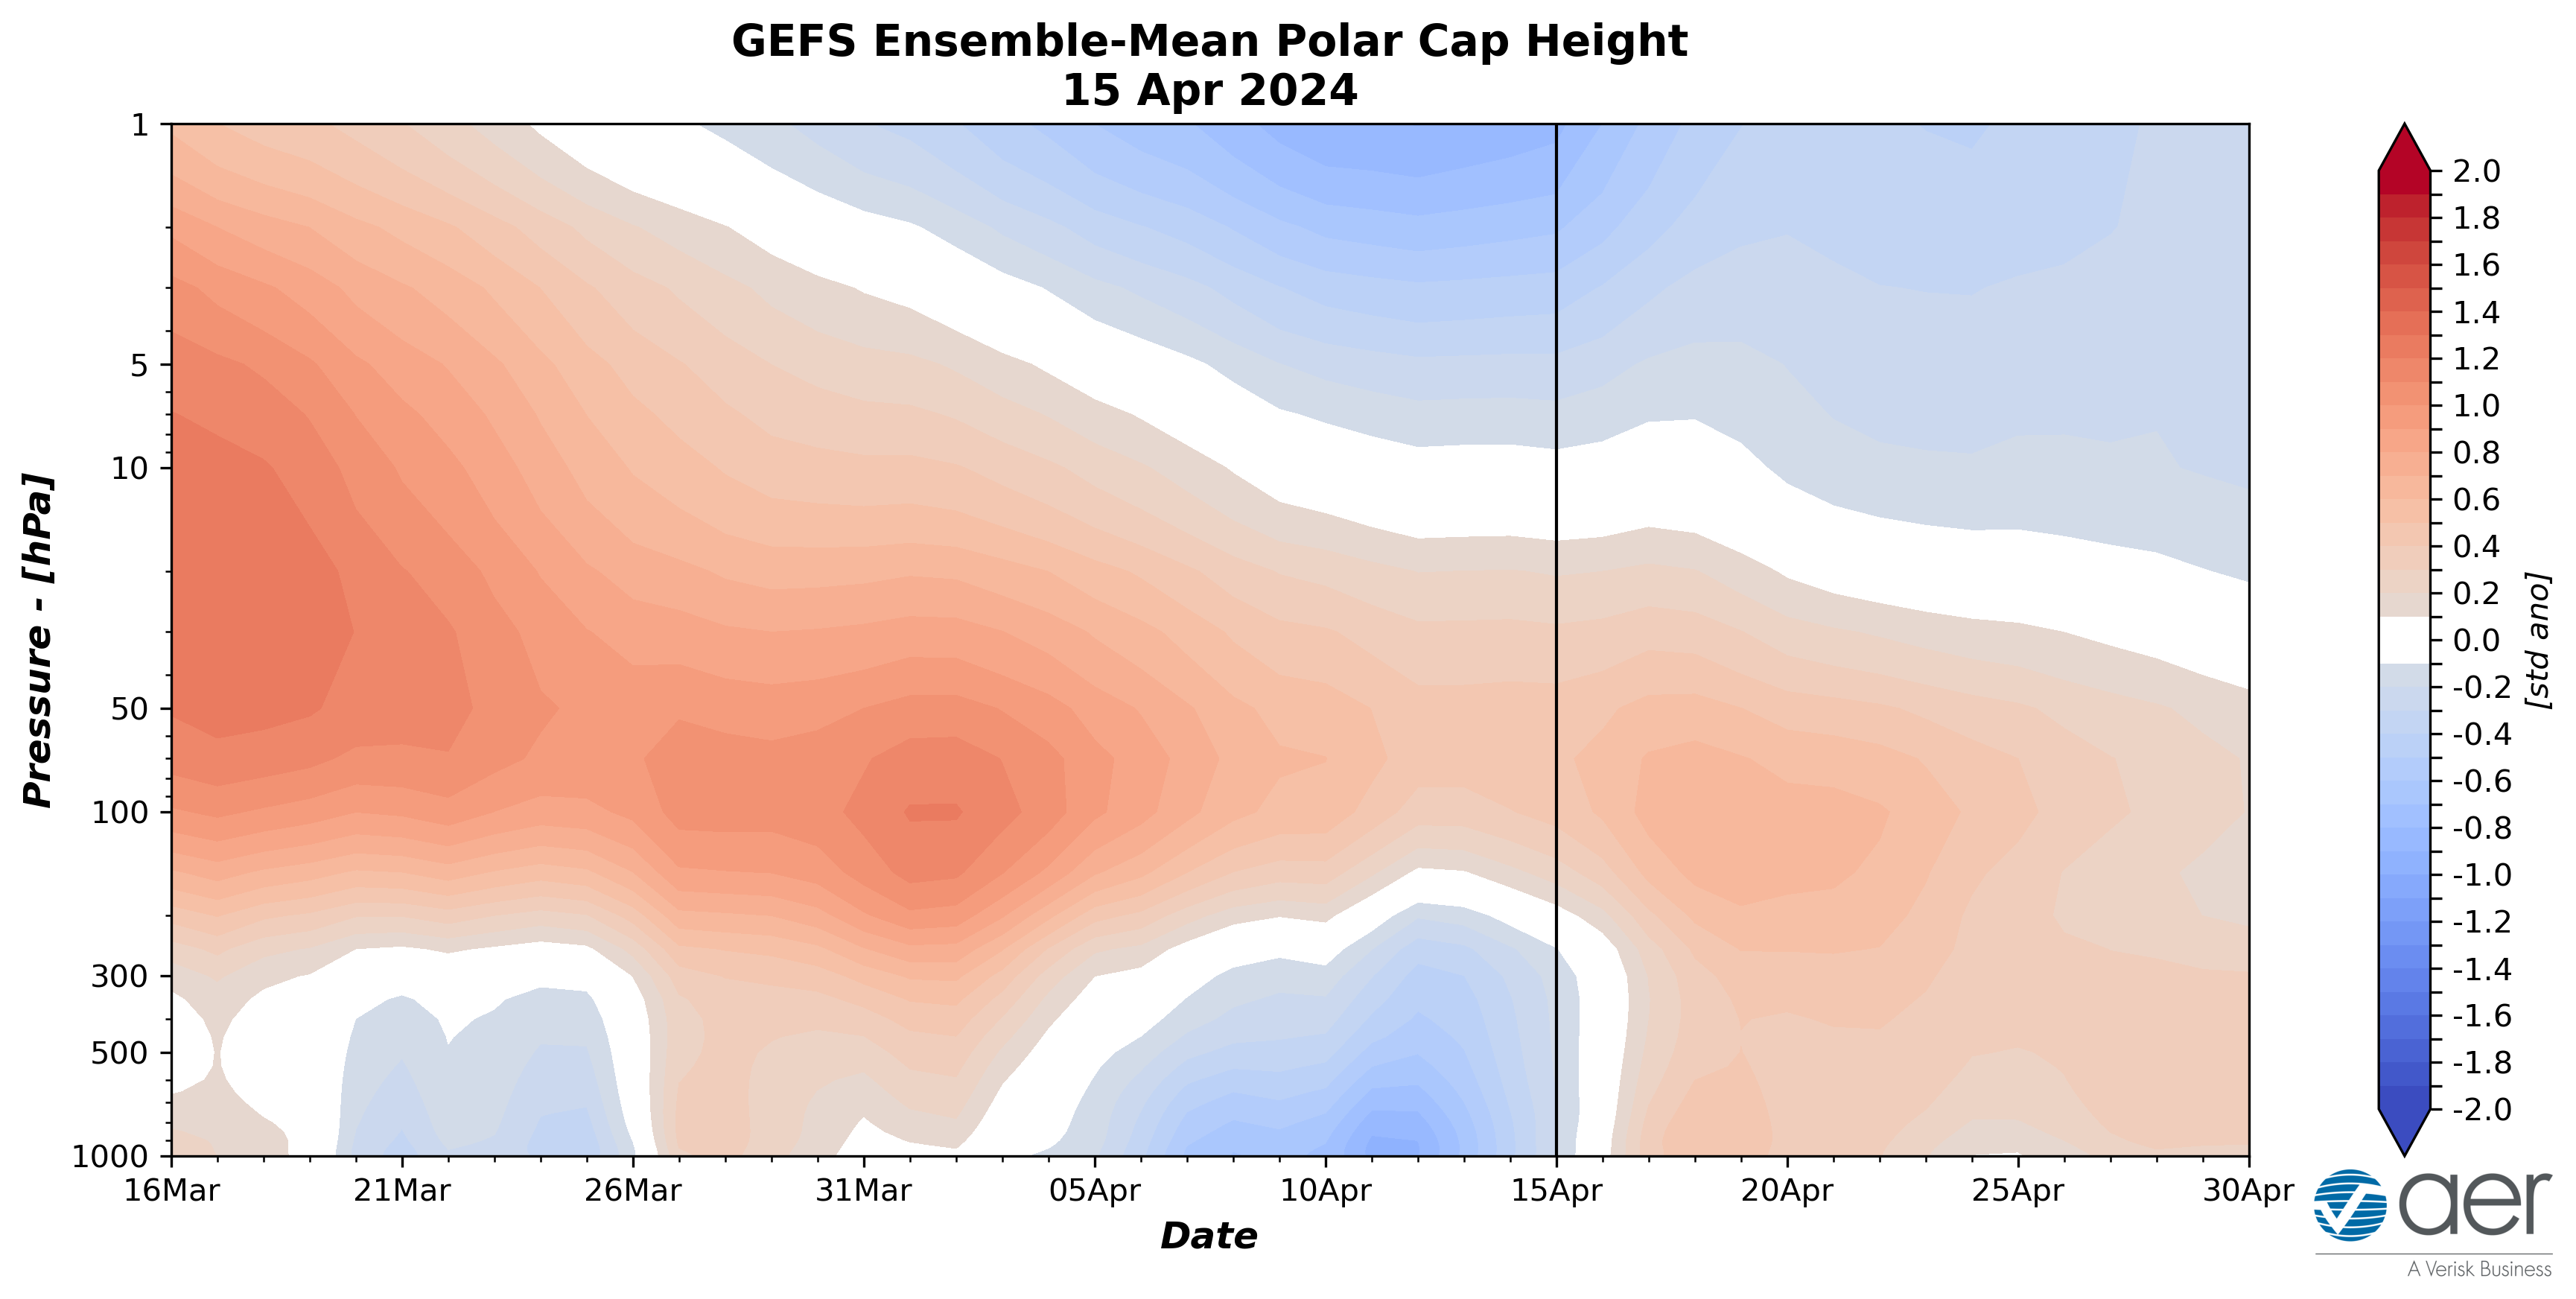
Figure 11. Observed and predicted daily polar cap height (i.e., area-averaged geopotential heights poleward of 60°N) standardized anomalies. The forecast is from the 00Z 15 April 2024 2024 GFS ensemble.
The predicted neutral to cold/negative PCHs in the lower troposphere early this week (Figure 11) are consistent with the predicted positive surface AO early this week (Figure 1). However, starting later this week the neutral to negative surface AO is consistent with switch to warm/positive PCHs in the troposphere.
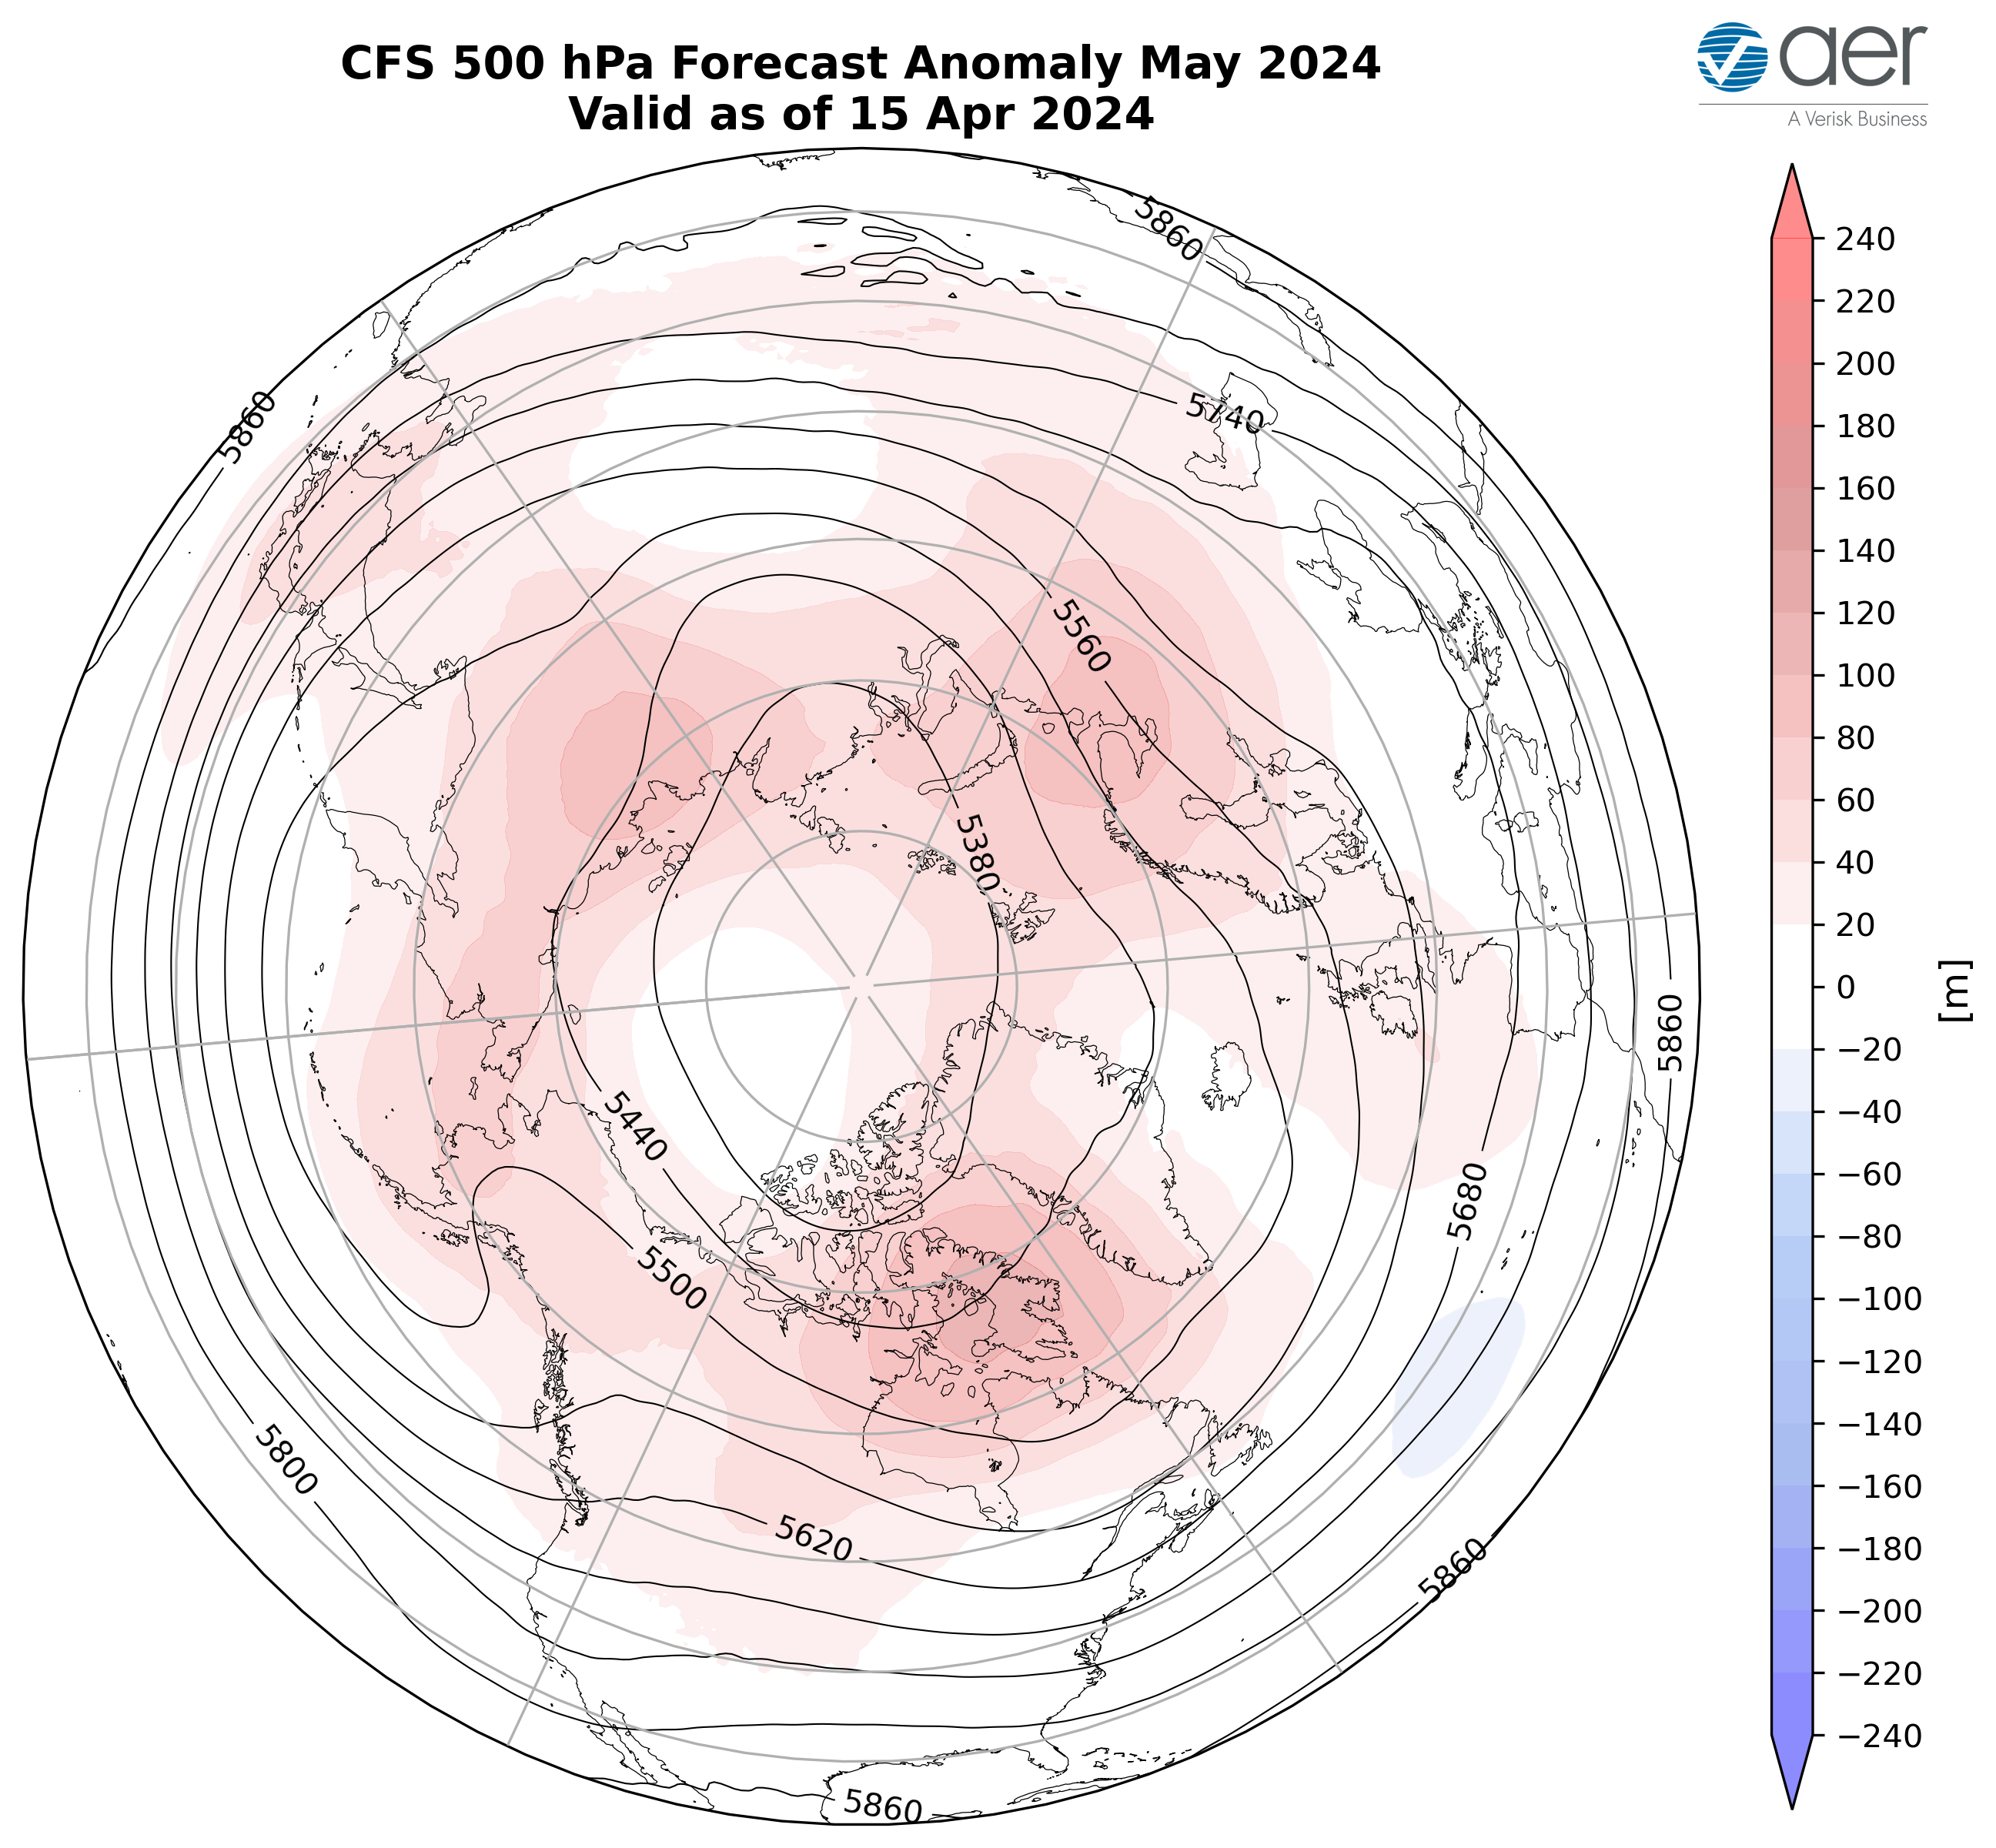
Figure 12. Forecasted average 500 mb geopotential heights (dam; contours) and geopotential height anomalies (m; shading) across the Northern Hemisphere for May 2024. The forecasts are from the 00Z 15 April 2024 2024 CFS.
I include in this week’s blog the monthly 500 hPa geopotential heights (Figure 12) and surface temperatures for May (Figure 13) from the Climate Forecast System (CFS; the plots represent yesterday’s four ensemble members). The forecast for the troposphere is ridging centered Baffin Bay, Barents-Kara Seas, Siberia, Eastern Asia, Alaska and Western Canada with troughing in Southern Europe, Central Asia, the Southwestern US, Eastern Canada and the Northeastern US (Figure 12). This pattern favors seasonable to relatively warm temperatures across Northern Europe, much of Asia including Siberia, Alaska, much of Canada and the Northwestern US with seasonable to relatively cold temperatures across parts of Central Asia, Southeastern Canada, Southwestern US and the Eastern US (Figure 13).
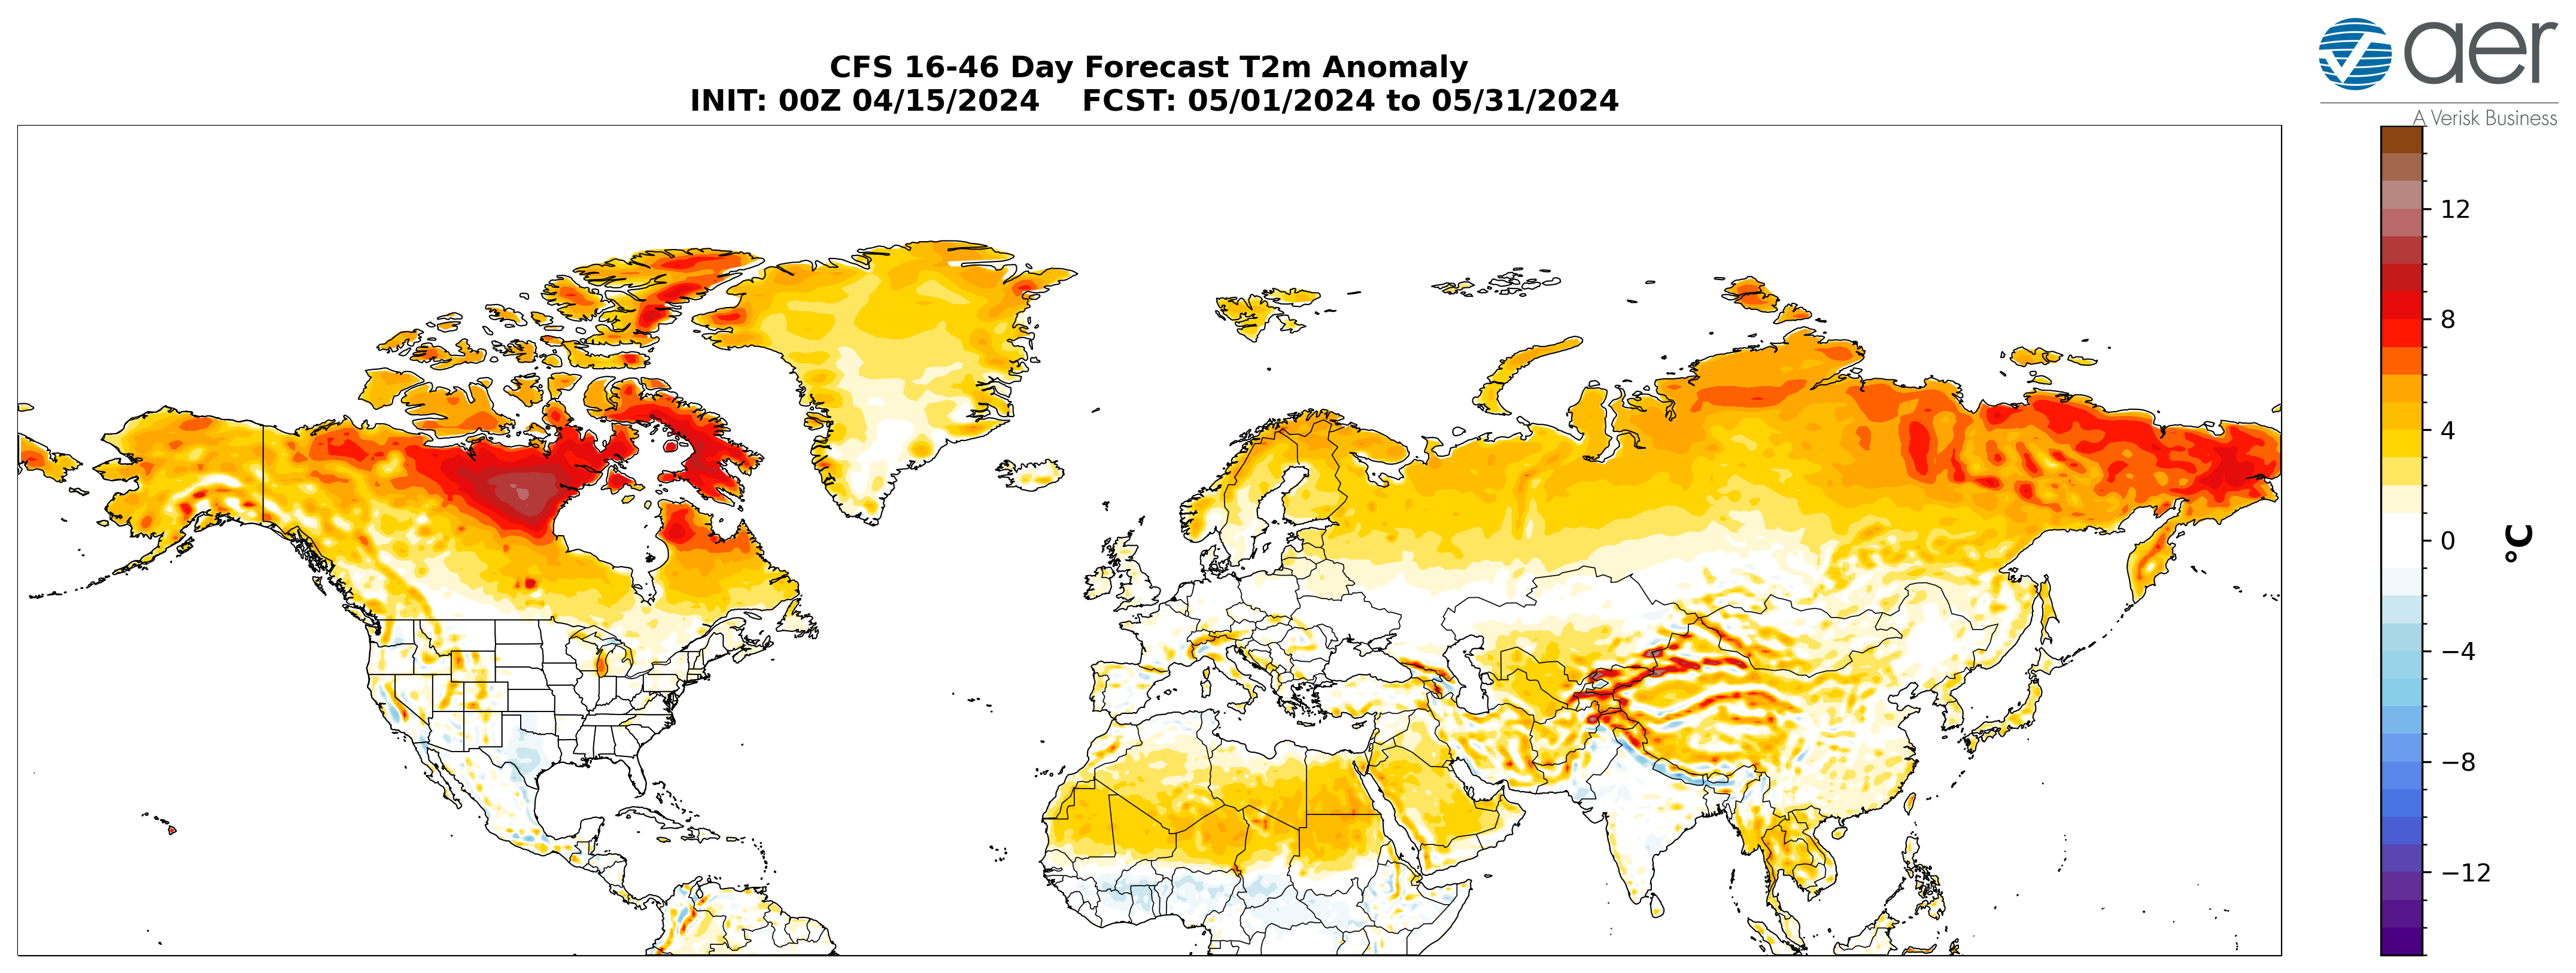
Figure 13. Forecasted average surface temperature anomalies (°C; shading) across the Northern Hemisphere for May 2024. The forecasts are from the 00Z 15 April 2024 CFS.
SSTs/El Niño/Southern Oscillation
Equatorial Pacific sea surface temperatures (SSTs) anomalies are well above normal, especially along the South America coast, indicating that and El Niño remains strong (Figure 14) and El Niño conditions are expected through the the spring. Observed SSTs across the NH remain well above normal especially in the central North Pacific (west of recent years), the western North Pacific, the eastern North Atlantic and offshore of eastern North America though below normal SSTs exist regionally especially in the South and North Pacific and the North Atlantic.
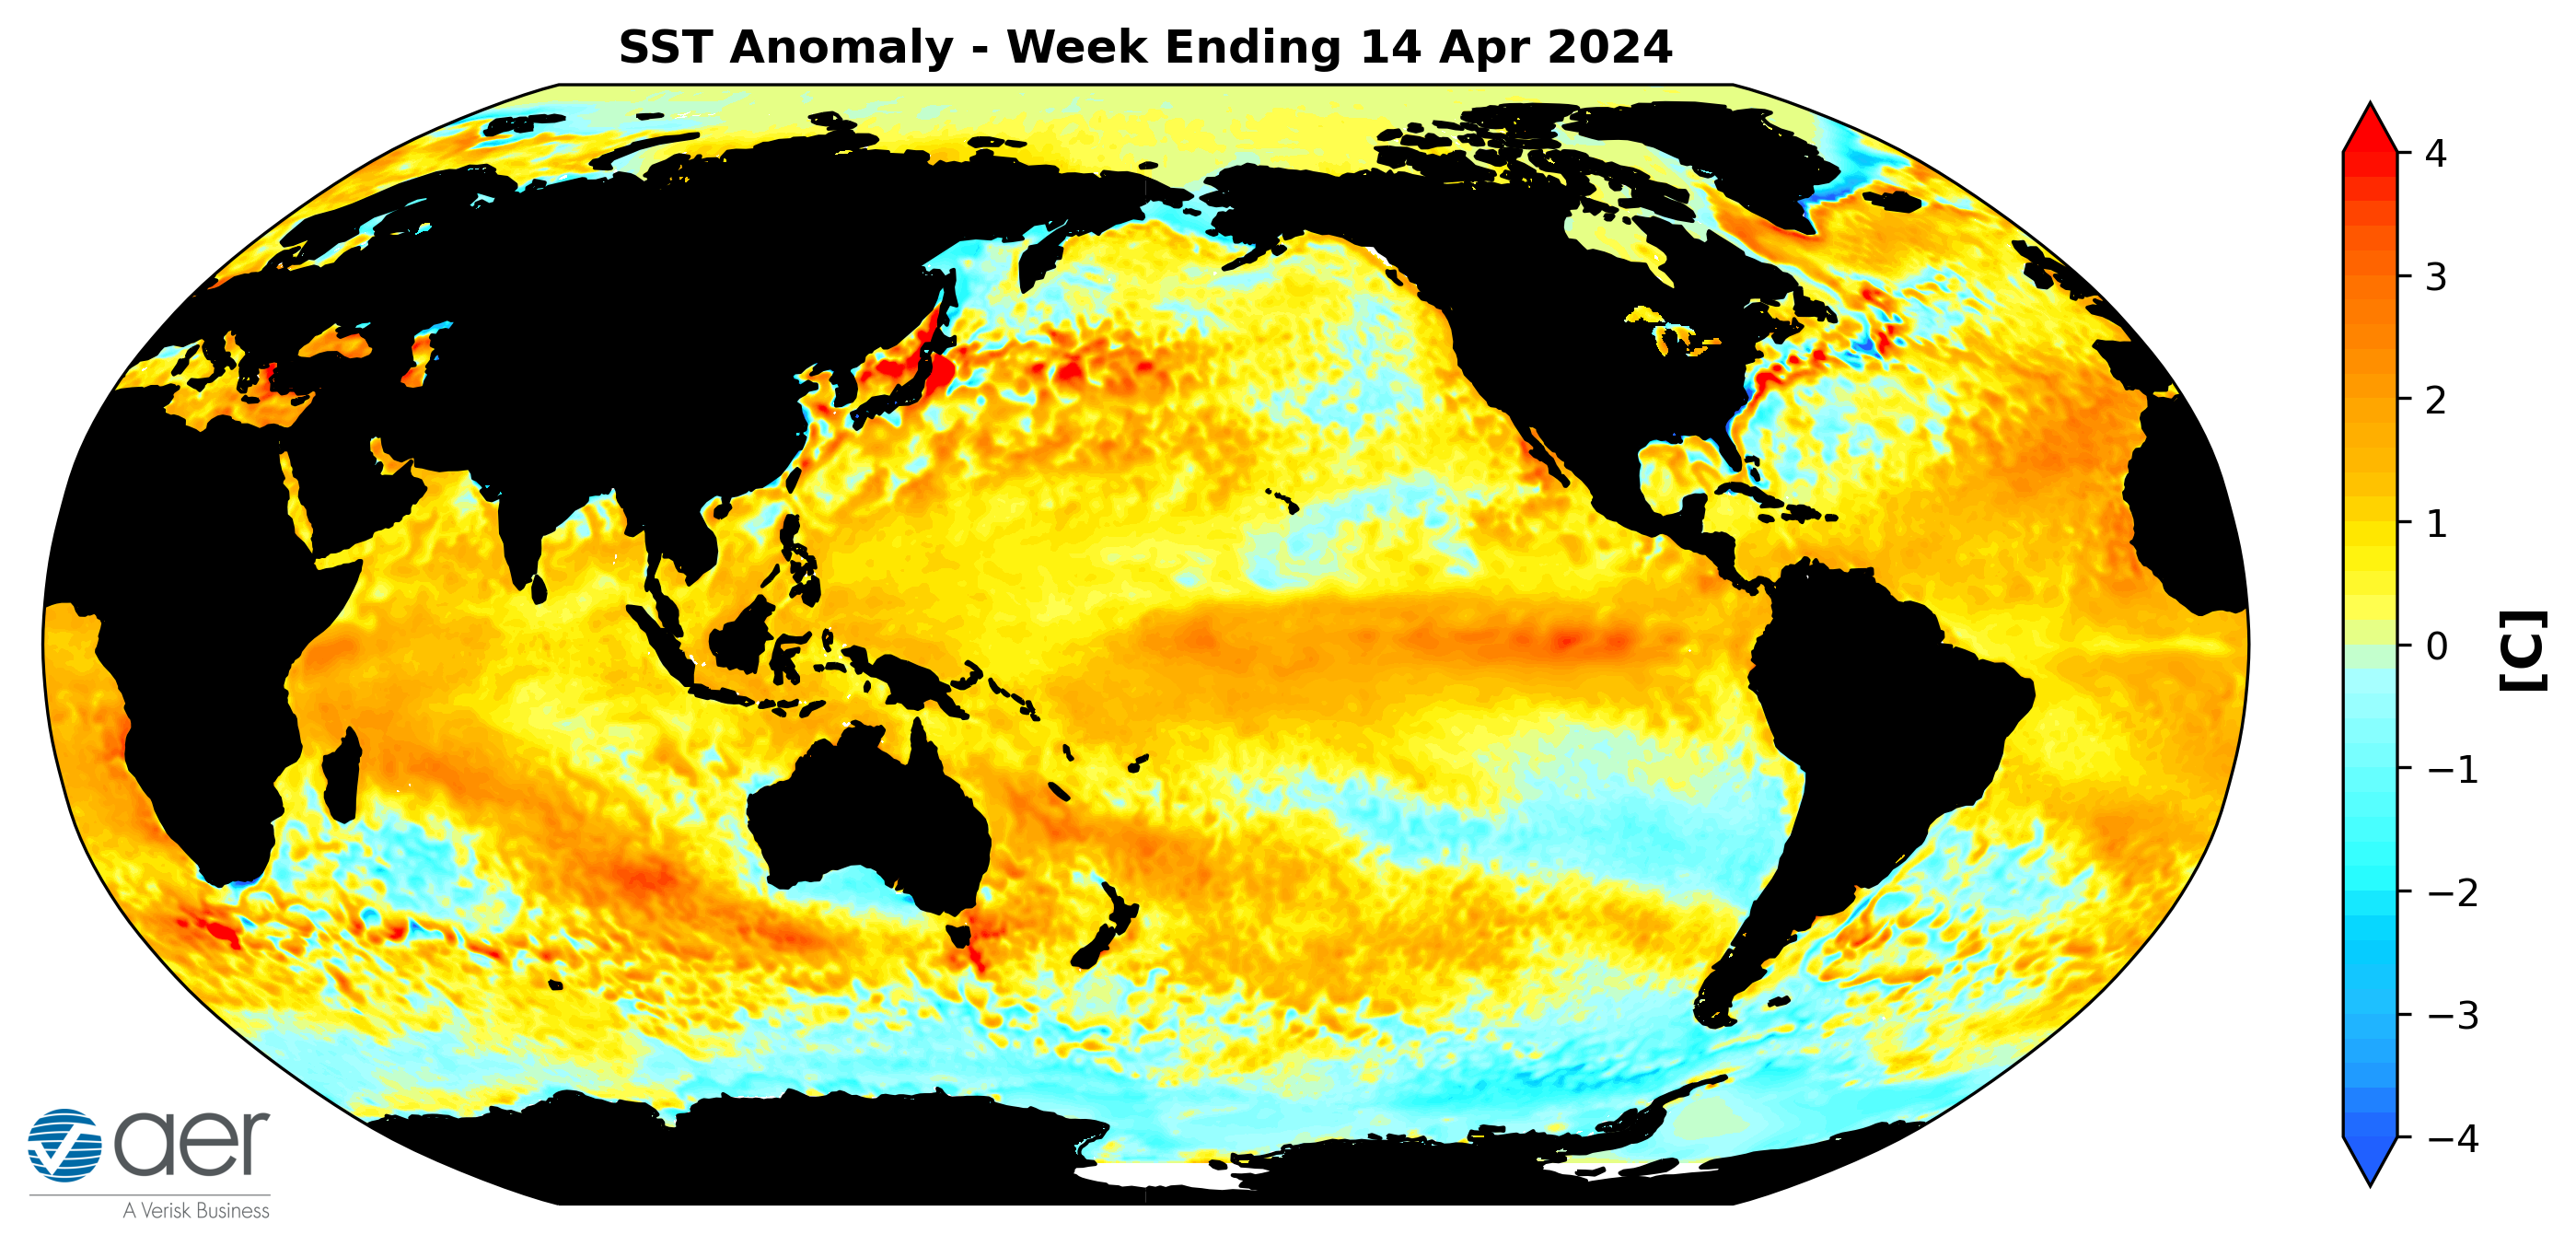
Figure 14. The latest weekly-mean global SST anomalies (ending 14 April 2024). Data from NOAA OI High-Resolution dataset.
Madden Julian Oscillation
Currently the Madden Julian Oscillation (MJO) is in phase four but barely (Figure 15). The forecasts are for the MJO to quickly weaken to where no phase is favored. Therefore the MJO seems to be having little influence on the weather across North America weather this week into next week. But admittedly this is outside of my expertise.
Figure 15. Past and forecast values of the MJO index. Forecast values from the 00Z 15 April 2024 ECMWF model. Yellow lines indicate individual ensemble-member forecasts, with the green line showing the ensemble-mean. A measure of the model “spread” is denoted by the gray shading. Sector numbers indicate the phase of the MJO, with geographical labels indicating where anomalous convection occurs during that phase. Image source: https://www.cpc.ncep.noaa.gov/products/precip/CWlink/MJO/CLIVAR/clivar_wh.shtml
Get Detailed Seasonal Weather Intelligence with sCast
We appreciate your taking the time to read the public Arctic Oscillation blog from Dr. Judah Cohen and the AER Seasonal Forecasting team.
Dr. Cohen’s detailed monthly seasonal forecast, sCast, is also available for purchase. sCast provides a monthly 30-60-90-180-day outlook into temperature and precipitation, solar flux and wind anomalies across the globe, and regional population weighted cooling and heating degree forecasts for the US.
Our sCast principal engineer, Karl Pfeiffer, can help you use sCast and other AER seasonal forecast products to deliver important, long-lead time weather intelligence to your business. Please reach out to Karl today!

 (click image to play)