
During the 2019 growing season, Dr. Eric Hunt of Atmospheric and Environmental Research, Inc. will be providing weekly updates of the soil moisture index (SMI) from the Noah-MP land surface model in the NASA LIS framework for the eastern 3/4 of the U.S. where row-crop agriculture is more common. The Evaporative Stress Index (ESI) will also be included in our analysis once data for all of the U.S. are available later this season. The analysis is intended to provide the larger agricultural and meteorological communities insight as to areas where soil moisture is excessive or deficient compared to average for that location and what that may mean for impacts. It is my goal that these maps can be an early warning signal for flash drought development or where flash flooding could be likely in the coming week if heavy precipitation materializes. Please be advised that the SMI should be viewed as complementary, not a substitute, to the U.S. Drought Monitor (USDM) and that declarations of drought for a particular location should never be based on the SMI alone.
This blog post was partially supported by NASA grant NNH16CT05C.
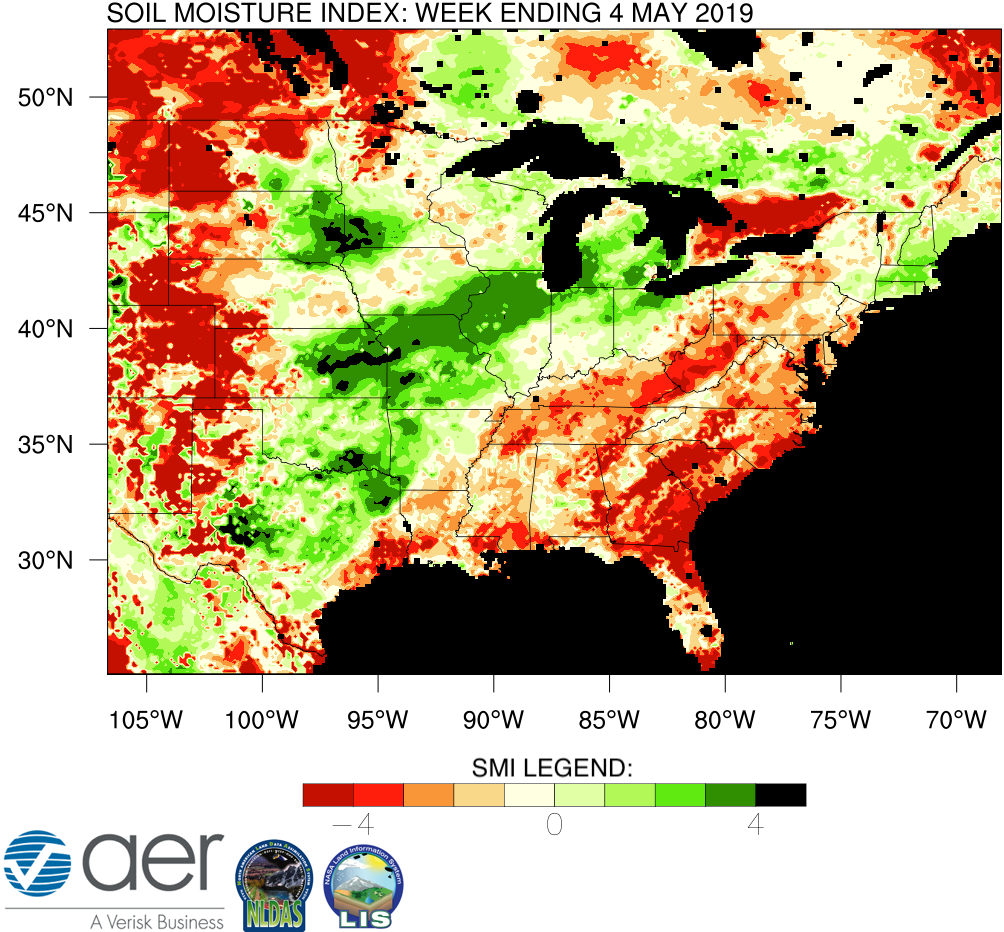
Figure 1. The Soil Moisture Index (SMI) for the 7-day period ending 4 May 2019. Results are based on output from the 0-1 m (surface to 3.23 feet) layers in the Noah-Multiparameterization (Noah-MP) land surface model. Noah-MP is run in the NASA Land Information System (LIS) framework with the North American Land Data Assimilation Version 2 (NLDAS-2) forcing dataset. The SMI calculation is based on the soil moisture index created in Hunt et al. (2009) such that ‘5’(dark green) is the wettest and ‘-5’ (dark red) the driest for the period of record. The period of record used calculate the SMI for the current map is 1979-present.
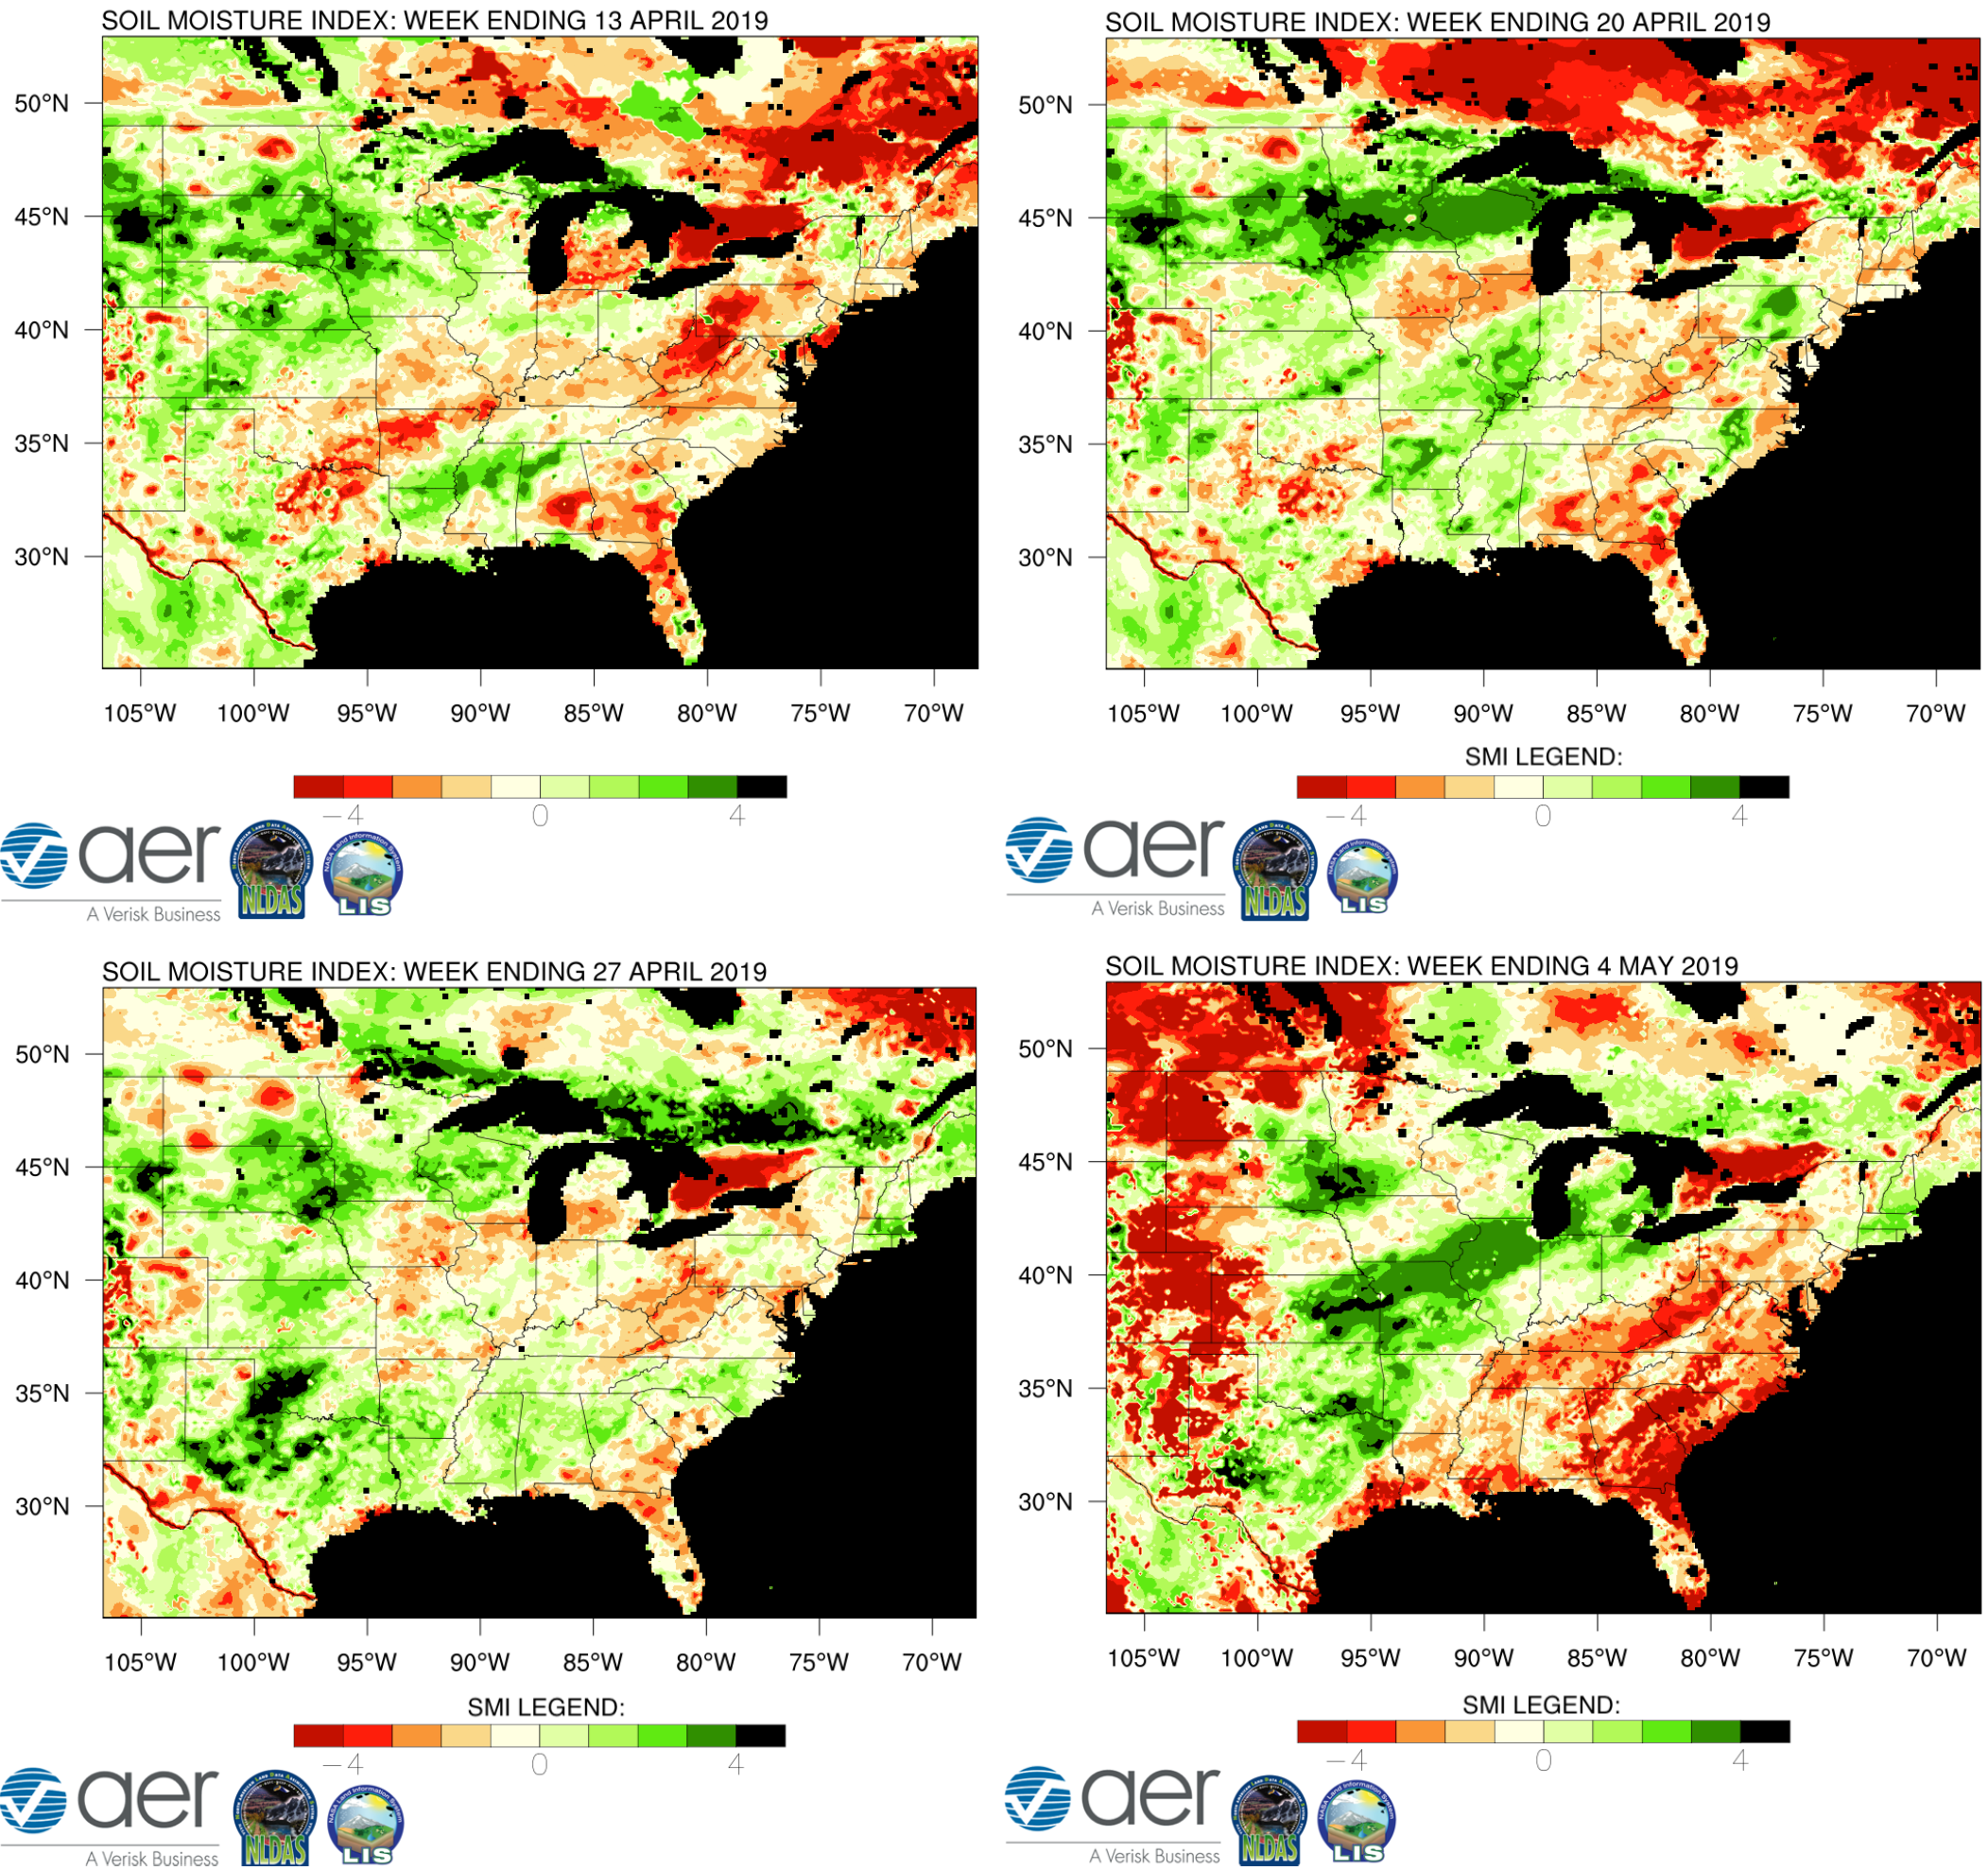
Figure 2. Comparison of this week’s SMI map the last three week’s SMI maps.
Narrative:
Significant moistening occurred over the Midwest, particularly from Kansas into Illinois. As has been the case for the entire spring, soils were abnormally moist across eastern South Dakota into southern Minnesota. Soils remained most into much of Oklahoma and into Texas and into New England.
Most of the eastern U.S. and High Plains region saw significant drying of the soil according to Noah-MP. The latest U.S. Drought Monitor still shows abnormal dryness and moderate drought occurring along the Gulf Coast and into South Carolina and has introduced some abnormal dryness in a few pockets of the High Plains.