
During the 2019 growing season, Dr. Eric Hunt of Atmospheric and Environmental Research, Inc. will be providing weekly updates of the soil moisture index (SMI) from the Noah-MP land surface model in the NASA LIS framework for the eastern 3/4 of the U.S. where row-crop agriculture is more common. The Evaporative Stress Index (ESI) is now included in our analysis. The analysis is intended to provide the larger agricultural and meteorological communities insight as to areas where soil moisture is excessive or deficient compared to average for that location and what that may mean for impacts. It is my goal that these maps can be an early warning signal for flash drought development or where flash flooding could be likely in the coming week if heavy precipitation materializes. Please be advised that the SMI should be viewed as complementary, not a substitute, to the U.S. Drought Monitor (USDM) and that declarations of drought for a particular location should never be based on the SMI alone.
This blog post was partially supported by NASA grant NNH16CT05C.

Figure 1. The Soil Moisture Index (SMI) for the 7-day period ending 6 July 2019. Results are based on output from the 0-1 m (surface to 3.23 feet) layers in the Noah-Multiparameterization (Noah-MP) land surface model. Noah-MP is run in the NASA Land Information System (LIS) framework with the North American Land Data Assimilation Version 2 (NLDAS-2) forcing dataset. The SMI calculation is based on the soil moisture index created in Hunt et al. (2009) such that ‘5’(dark green) is the wettest and ‘-5’ (dark red) the driest for the period of record. The period of record used calculate the SMI for the current map is 1979-present.
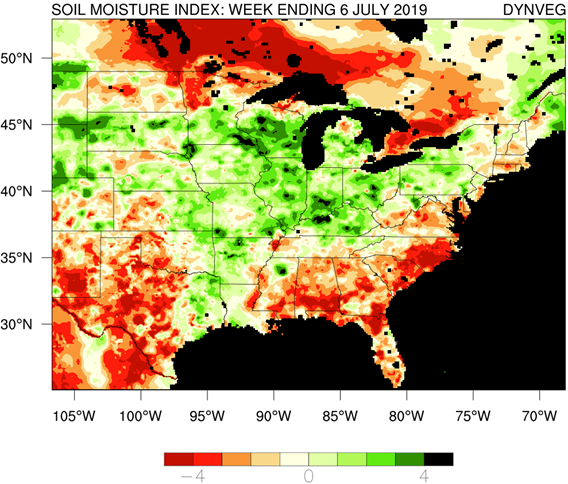
Figure 2. Same as Figure 1, except Noah-MP is run with a dynamic vegetation option, instead of a climatologically driven leaf area index (LAI).
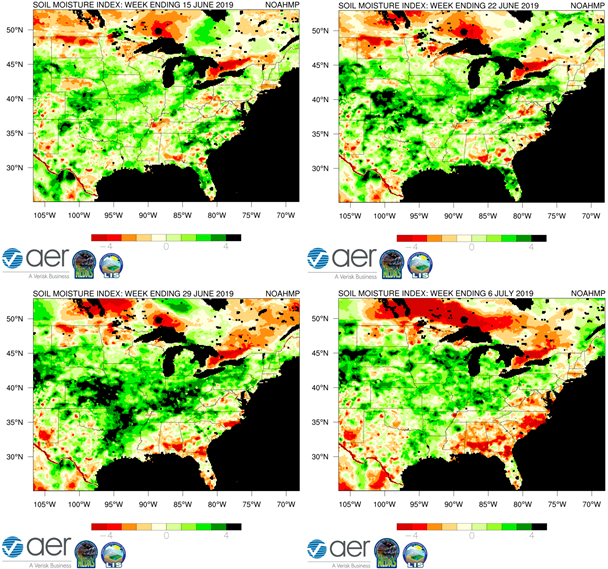
Figure 3. Comparison of this week’s SMI map the last three week’s SMI maps.

Figure 4. 1-month Evaporative Stress Index (ESI) from 8 July 2019. For additional information on the ESI, please refer to Anderson et al. (2012) and Otkin et al. (2013).
Narrative:
As has been the case for most of the season, the southeastern United States has mostly negative anomalies of soil moisture and most of the Corn Belt and Great Plains region is moist to excessively moist. This is in good agreement with the latest Drought Monitor. This moisture in the Corn Belt will come in handy as most of the region is about to enter a prolonged stretch of heat. This doesn’t look to be a record setting heat wave but a decent stretch of highs in the 90’s and lows in the 70’s for most of the region While the heat could be welcome in some ways for crops that are well behind schedule, it could really tax fields that had issues with planting. Rainfall looks to be minimal in the region south of Highway 30 but some places along and north of there could receive excessive rainfall this weekend.
The 1-month ESI shows predominantly negative values over the Gulf Coast, southeast Arkansas, and across much of the central Corn Belt. As your correspondent can attest on a drive last weekend from eastern Nebraska into Chicago, corn is generally way behind schedule and in poor condition across a lot of northern Illinois along I-80. The negative ESI values in that area could well be reflective of that.
Two weeks ago I showed a plot comparing current corn conditions and the eventual trend. That seemed to be relatively popular so I’ll keep this as a regular part of the blog for the next few weeks. For reference, the red circles show the percent of corn rated Excellent/Good minus the corn rated Poor/Very Poor (EG-PVP) from this same week in the year back to 1986 and the blue squares represent the eventual trend from that year. As of this week, that difference is 45 percent, which is well below the median of 61 percent. That puts it 7th from the bottom dating back to 1986 and of the six below it, only two ended up above trend. For additional insights, we offer a commercial forecast on our website.
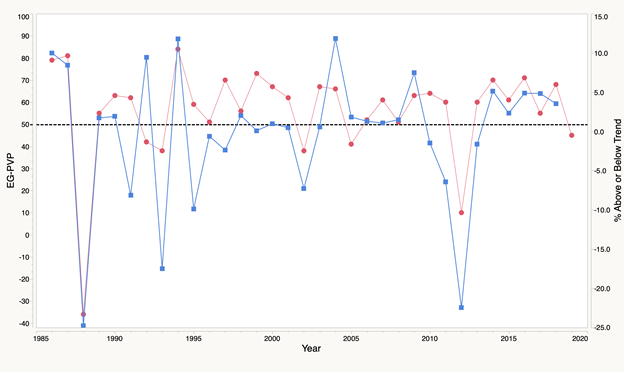
Figure 5. Percent of corn rated Excellent or Good minus the percent of corn rated Poor or Very Poor for Week 27 dating back to 1986 (red circles) and the final corn trend (blue squares). Data courtesy of USDA NASS.