
During the 2019 growing season, Dr. Eric Hunt of Atmospheric and Environmental Research, Inc. will be providing weekly updates of the soil moisture index (SMI) from the Noah-MP land surface model in the NASA LIS framework for the eastern 3/4 of the U.S. where row-crop agriculture is more common. The Evaporative Stress Index (ESI) is now included in our analysis. The analysis is intended to provide the larger agricultural and meteorological communities insight as to areas where soil moisture is excessive or deficient compared to average for that location and what that may mean for impacts. It is my goal that these maps can be an early warning signal for flash drought development or where flash flooding could be likely in the coming week if heavy precipitation materializes. Please be advised that the SMI should be viewed as complementary, not a substitute, to the U.S. Drought Monitor (USDM) and that declarations of drought for a particular location should never be based on the SMI alone.
This blog post was partially supported by NASA grant NNH16CT05C.
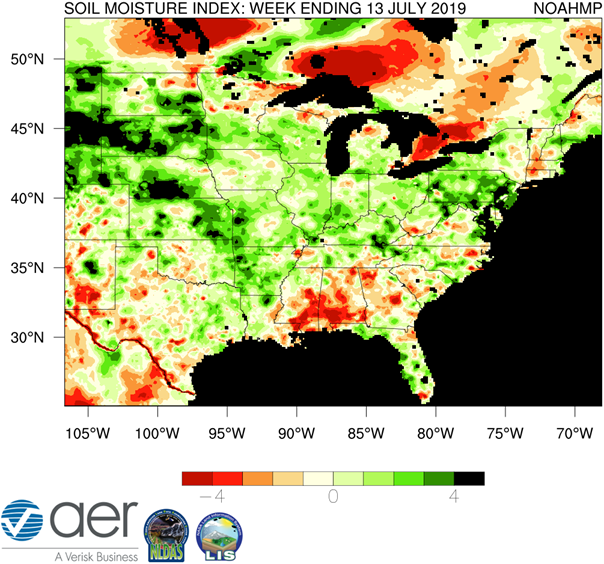
Figure 1. The Soil Moisture Index (SMI) for the 7-day period ending 13 July 2019. Results are based on output from the 0-1 m (surface to 3.23 feet) layers in the Noah-Multiparameterization (Noah-MP) land surface model. Noah-MP is run in the NASA Land Information System (LIS) framework with the North American Land Data Assimilation Version 2 (NLDAS-2) forcing dataset. The SMI calculation is based on the soil moisture index created in Hunt et al. (2009) such that ‘5’(dark green) is the wettest and ‘-5’ (dark red) the driest for the period of record. The period of record used calculate the SMI for the current map is 1979-present.
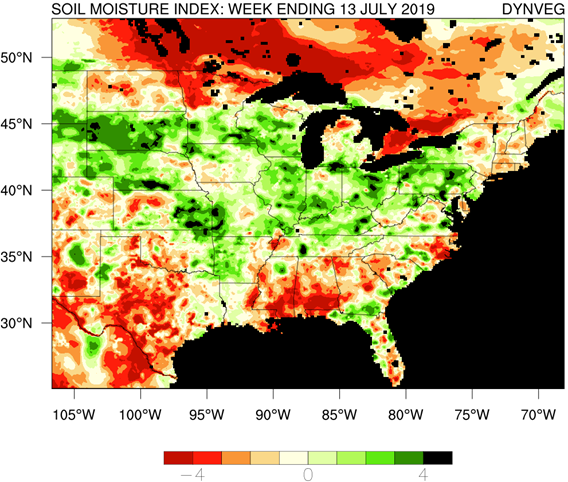
Figure 2. Same as Figure 1, except Noah-MP is run with a dynamic vegetation option, instead of a climatologically driven leaf area index (LAI).
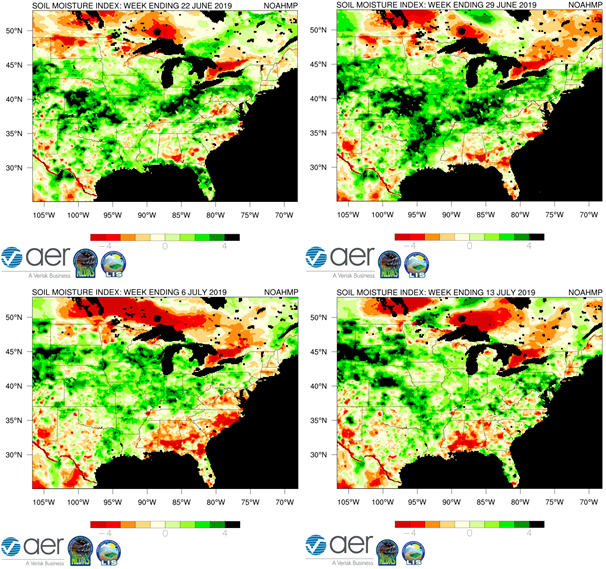
Figure 3. Comparison of this week’s SMI map the last three week’s SMI maps.
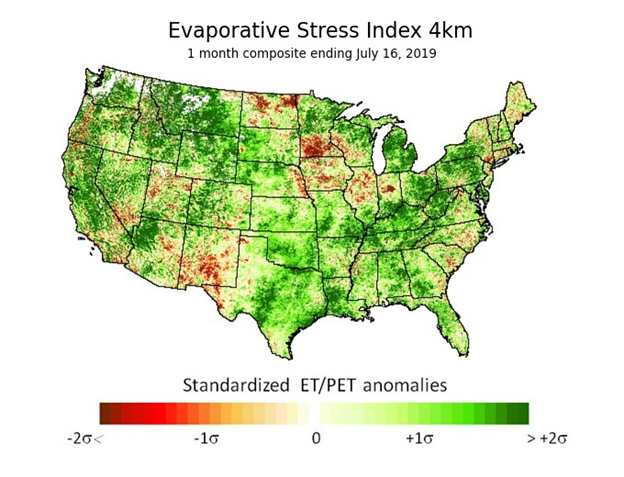
Figure 4. 1-month Evaporative Stress Index (ESI) from 16 July 2019. For additional information on the ESI, please refer to Anderson et al. (2012) and Otkin et al. (2013).
Narrative:
The soil moisture index (SMI) maps remained relatively unchanged from the 6th to the 13th, although much of the Corn Belt did dry out some. Note that the effects from Tropical Storm Barry will be reflected in next week’s map. Overall the SMI (with the Noah-MP land surface model) is in good agreement with the latest Drought Monitor. As has been the case for the majority of the season, the dynamic vegetation simulation has been more aggressive with drying out the soils, with differences most substantial in west Texas and central Kansas. Thankfully some of the Corn Belt has caught come recent rain so perhaps the decline in soil moisture on next week’s map won’t be as dramatic as it could be. Regardless, we don’t seem to be heading toward a 1983 type of flash drought, as I wrote about on Monday.
The 1-month ESI does show a lot of pockets of negative anomalies in the Corn Belt and those pockets are worth watching to see if that signal persists.
Corn condition improved slightly last week and there is now some pretty decent separation between years like 1988 and 2012, which were in excess of 20 points below trend. However, the difference between the percent of corn in the Excellent-Good (EG) condition categories and Poor-Very Poor (PVP) condition categories is under 50 percent. In other years where that was the case this deep into the season, only 1989 and 2005 had above trend corn (marginally at that). But the good news is that number has been relatively stable over the past three weeks (i.e., not trending down toward the depths of 1988). In my opinion, locations that have decent corn after this brief heat wave likely will have a good, but not record breaking crop come harvest time. So if the difference in EG-PVP is still close to 50 percent at this time next week, that is a signal to me that the chance of corn finishing more than 10 points below trend nationally is quite low.

Figure 5. Percent of corn rated Excellent or Good minus the percent of corn rated Poor or Very Poor for Week 28 dating back to 1986 (red circles) and the final corn trend (blue squares). Data courtesy of USDA NASS.