
During the 2019 growing season, Dr. Eric Hunt of Atmospheric and Environmental Research, Inc. will be providing weekly updates of the soil moisture index (SMI) from the Noah-MP land surface model in the NASA LIS framework for the eastern 3/4 of the U.S. where row-crop agriculture is more common. The Evaporative Stress Index (ESI) is now included in our analysis. The analysis is intended to provide the larger agricultural and meteorological communities insight as to areas where soil moisture is excessive or deficient compared to average for that location and what that may mean for impacts. It is my goal that these maps can be an early warning signal for flash drought development or where flash flooding could be likely in the coming week if heavy precipitation materializes. Please be advised that the SMI should be viewed as complementary, not a substitute, to the U.S. Drought Monitor (USDM) and that declarations of drought for a particular location should never be based on the SMI alone.
This blog post was partially supported by NASA grant NNH16CT05C.
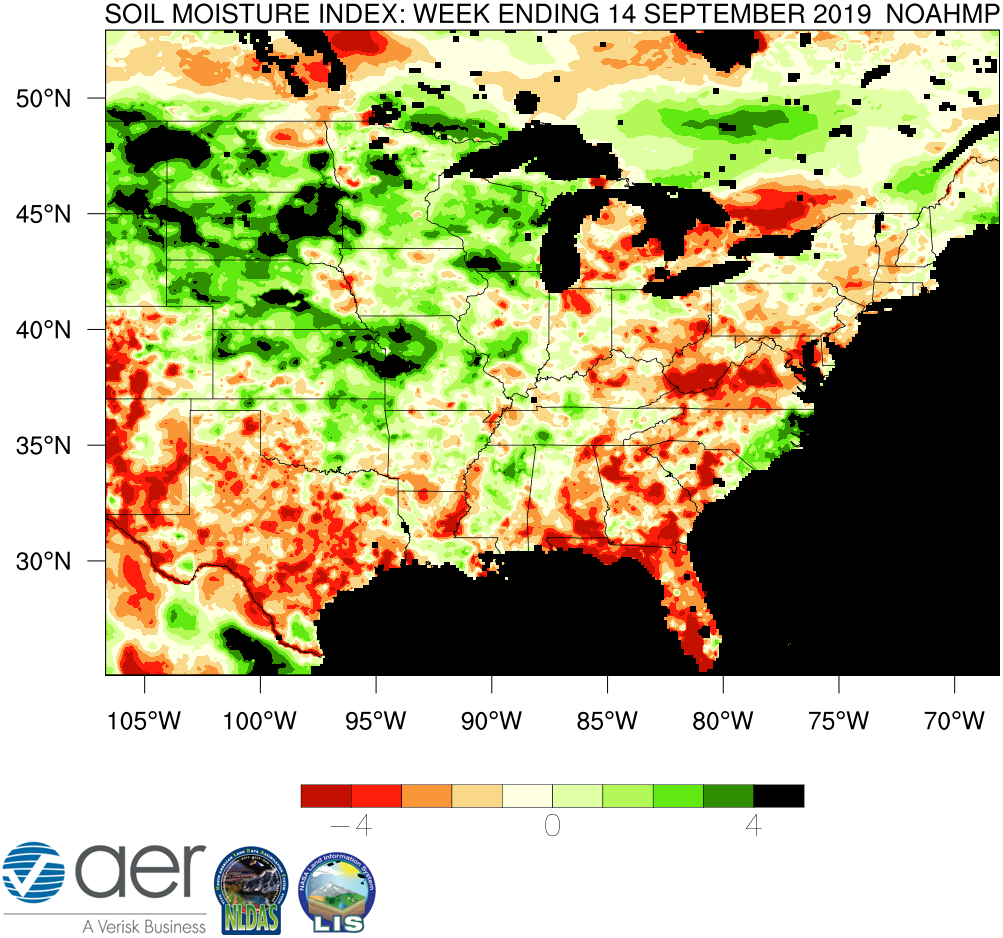
Figure 1. The Soil Moisture Index (SMI) for the 7-day period ending 14 September 2019. Results are based on output from the 0-1 m (surface to 3.23 feet) layers in the Noah-Multiparameterization (Noah-MP) land surface model. Noah-MP is run in the NASA Land Information System (LIS) framework with the North American Land Data Assimilation Version 2 (NLDAS-2) forcing dataset. The SMI calculation is based on the soil moisture index created in Hunt et al. (2009) such that ‘5’(dark green) is the wettest and ‘-5’ (dark red) the driest for the period of record. The period of record used calculate the SMI for the current map is 1979-present.
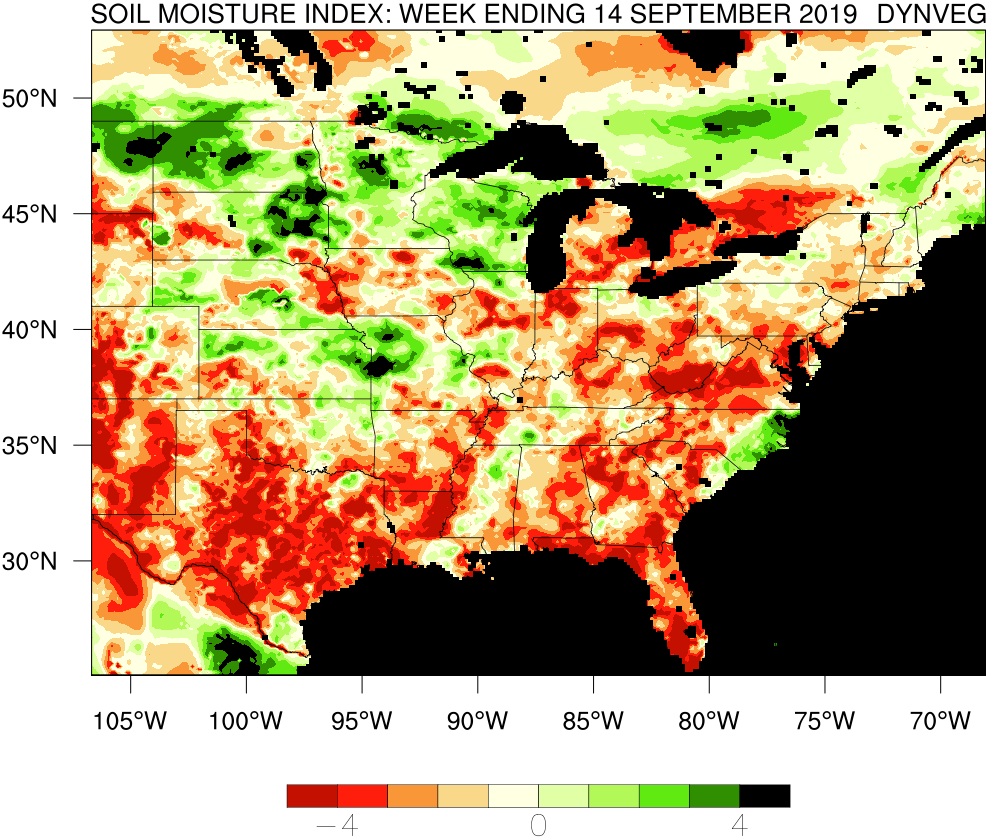
Figure 2. Same as Figure 1, except Noah-MP is run with a dynamic vegetation option, instead of a climatologically driven leaf area index (LAI).
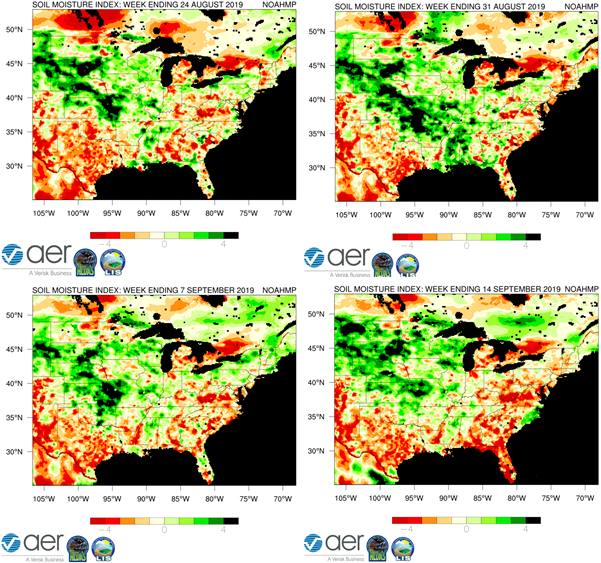
Figure 3. Comparison of this week’s SMI map the last three week’s SMI maps.
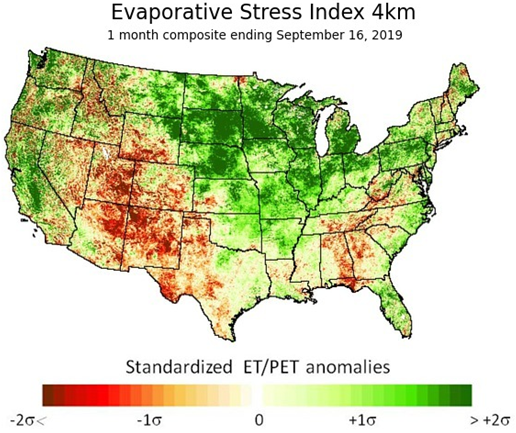
Figure 4. 1-month Evaporative Stress Index (ESI) from 16 September 2019. For additional information on the ESI, please refer to Anderson et al. (2012) and Otkin et al. (2013).
Narrative:
The spatial patterns of soil moisture anomalies that have been dominant since mid-summer mostly continued for another week. Significant positive anomalies of soil moisture (i.e., a high SMI) remained over much of Nebraska (excepting most of the far eastern section), South Dakota, southwestern Minnesota and from northeast Kansas into Missouri. The northern section of Illinois and southwestern Wisconsin also had very high values of the SMI last week. The remainder of the Corn Belt remained within a few points of a “neutral” SMI.
Negative anomalies of soil moisture persisted across almost all of Texas, in good agreement spatially with the U.S. Drought Monitor. As has been the case for three months, the dynamic vegetation simulation continues to be more aggressive with negative values of the SMI and is at -4 or lower in parts of west central Texas. Further to the north in Oklahoma, strong negative values of the SMI persist over the western section of the state, the eastern portion had mostly positive SMI’s (though much less so than in late August) and the central portion of the state remains the transition zone and the pendulum.
In the blog on 15 August, I mentioned that the south central and southeastern part of the U.S. would be worth watching carefully this fall and that I was skeptical of the CPC forecast calling for drought removal in the southeast. We’re getting close to astronomical fall and as shown by Figure 3, much of this region has started to dry. The exception of course is along the coast of the Carolinas where Dorian dropped significant precipitation earlier this month. Since the cutoff for this map (i.e., last Saturday), temperatures have been very warm and rainfall mostly absent. So I have no doubt that the SMI has continued to drop and many places in the south that have been drought free are going to be close to meeting the definition of flash drought by the end of the month, if not already there.
The southern Appalachian and Mid-Atlantic region also remains on the strongly negative side of the SMI, with areal coverage of said anomalies expanding spatially over the past few weeks with the above average temperatures.