
During the 2019 growing season, Dr. Eric Hunt of Atmospheric and Environmental Research, Inc. will be providing weekly updates of the soil moisture index (SMI) from the Noah-MP land surface model in the NASA LIS framework for the eastern 3/4 of the U.S. where row-crop agriculture is more common. The Evaporative Stress Index (ESI) will also be included in our analysis once data for all of the U.S. are available later this season. The analysis is intended to provide the larger agricultural and meteorological communities insight as to areas where soil moisture is excessive or deficient compared to average for that location and what that may mean for impacts. It is my goal that these maps can be an early warning signal for flash drought development or where flash flooding could be likely in the coming week if heavy precipitation materializes. Please be advised that the SMI should be viewed as complementary, not a substitute, to the U.S. Drought Monitor (USDM) and that declarations of drought for a particular location should never be based on the SMI alone.
This blog post was partially supported by NASA grant NNH16CT05C.
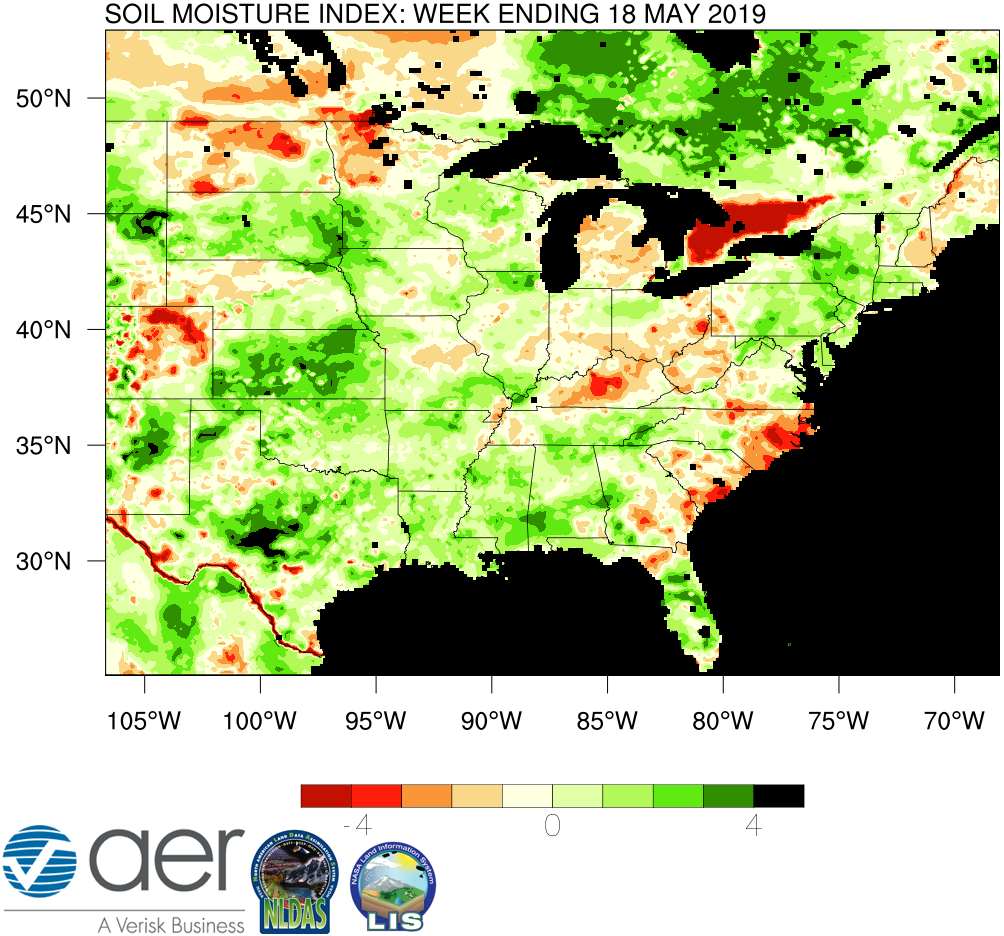
Figure 1. The Soil Moisture Index (SMI) for the 7-day period ending 18 May 2019. Results are based on output from the 0-1 m (surface to 3.23 feet) layers in the Noah-Multiparameterization (Noah-MP) land surface model. Noah-MP is run in the NASA Land Information System (LIS) framework with the North American Land Data Assimilation Version 2 (NLDAS-2) forcing dataset. The SMI calculation is based on the soil moisture index created in Hunt et al. (2009) such that ‘5’(dark green) is the wettest and ‘-5’ (dark red) the driest for the period of record. The period of record used calculate the SMI for the current map is 1979-present.
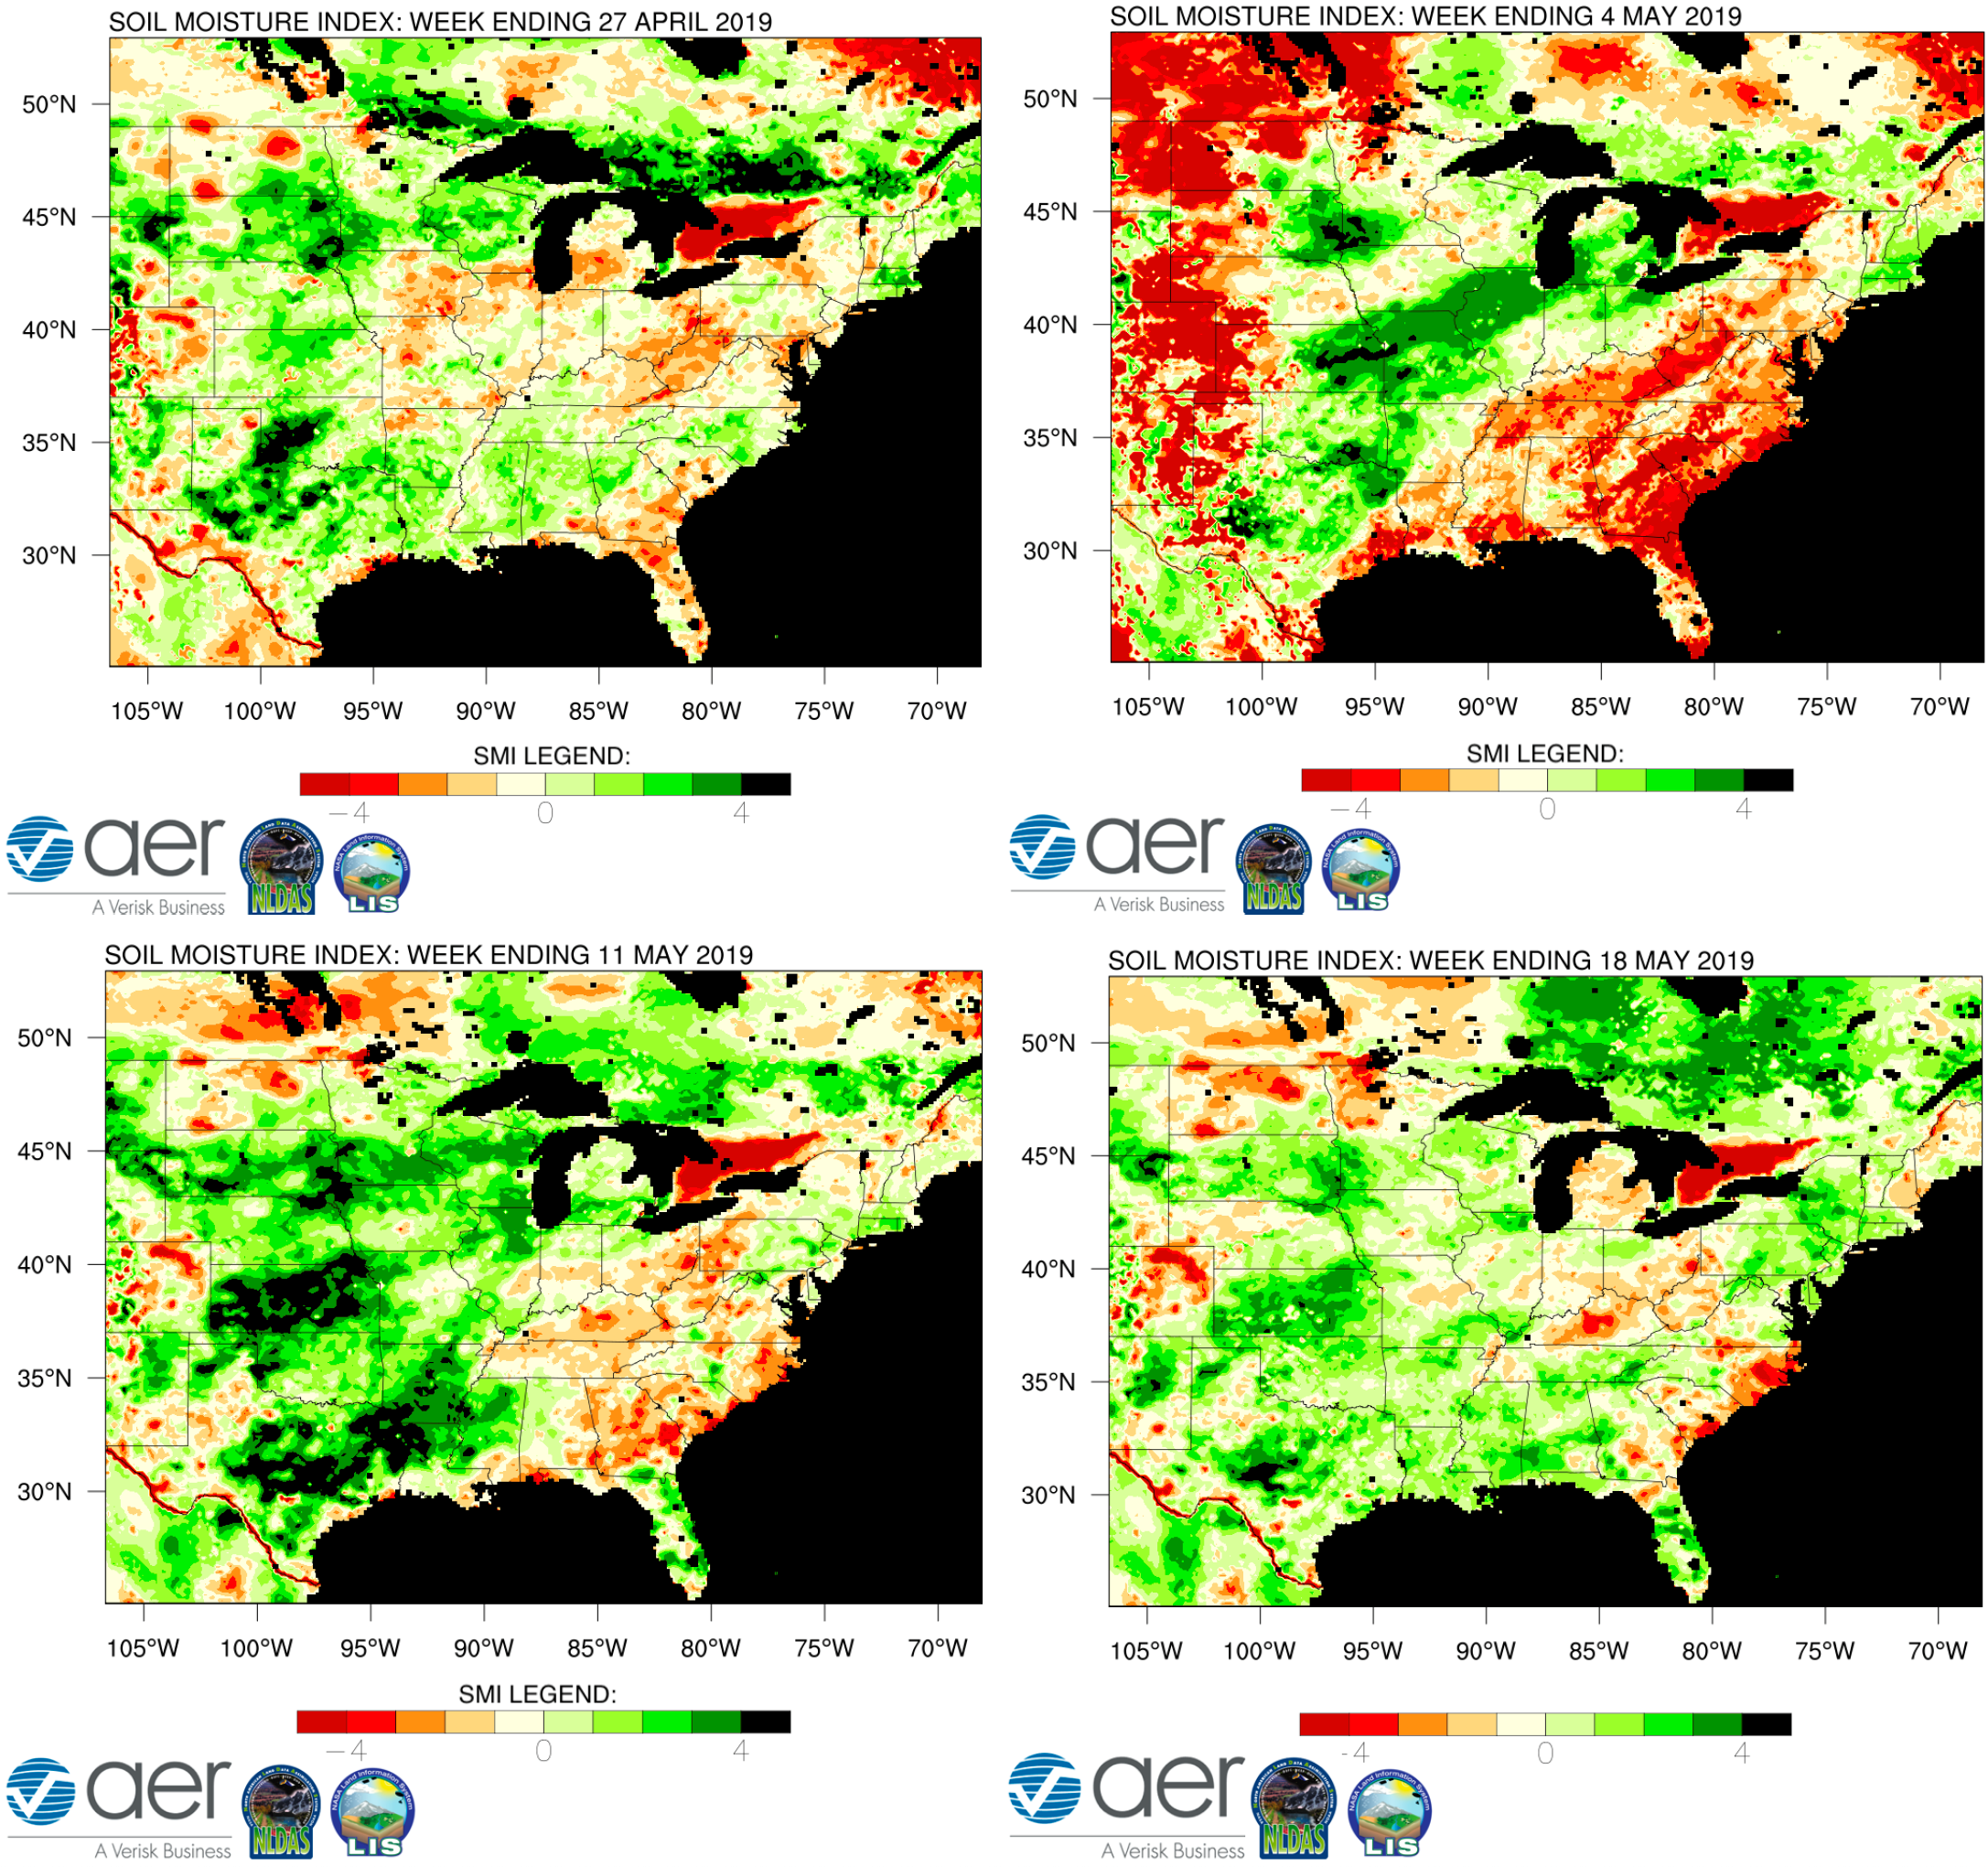
Figure 2. Comparison of this week’s SMI map the last three week’s SMI maps.
Narrative:
We are at a near record low for the amount of drought currently over the continental United States and in the eastern 2/3 of the U.S., there are only a few places that finished last week with drier than average soils according to Noah-MP. Specifically, North Dakota and northwest Minnesota, portions of the southeast coast, northeast Colorado, and central Kentucky had SMI values that indicated some deficiency of the top 1-m soil moisture (Figure 1). Elsewhere, the SMI was positive and many of the same areas that have been abnormally wet (e.g., much of the central U.S.) during this Flanagan Pluvial have received excessive rainfall since the data cutoff for this map. Next week’s map will no doubt show widespread high SMI values over much of the central U.S. and if the forecast for the next seven days holds up, there will be lots of green and dark green on this map into June.
As I mentioned last week, this moisture has had a negative effect on planting. Last week was better than the previous week across much of the Corn Belt, with many places in the Western Corn Belt exceeding 80F for multiple days without rain. However, planting is still behind schedule in much of the region, especially east of the Mississippi River. An article in this morning’s Wall Street Journal further reiterated the struggles in the Corn Belt because of the conditions over the past month. If this pluvial continues into mid-June, it is my thought that much of the region will be especially vulnerable to any heat that persists for more than a few days.
Reference: Flanagan, P.X., J.B. Basara, J.C. Furtado, and X. Xiao, 2018: Primary Atmospheric Drivers of Pluvial Years in the United States Great Plains. J. Hydrometeor., 19, 643–658,https://doi.org/10.1175/JHM-D-17-0148.1.