
During the 2019 growing season, Dr. Eric Hunt of Atmospheric and Environmental Research, Inc. will be providing weekly updates of the soil moisture index (SMI) from the Noah-MP land surface model in the NASA LIS framework for the eastern 3/4 of the U.S. where row-crop agriculture is more common. The Evaporative Stress Index (ESI) will also be included in our analysis once data for all of the U.S. are available later this season. The analysis is intended to provide the larger agricultural and meteorological communities insight as to areas where soil moisture is excessive or deficient compared to average for that location and what that may mean for impacts. It is my goal that these maps can be an early warning signal for flash drought development or where flash flooding could be likely in the coming week if heavy precipitation materializes. Please be advised that the SMI should be viewed as complementary, not a substitute, to the U.S. Drought Monitor (USDM) and that declarations of drought for a particular location should never be based on the SMI alone.
This blog post was partially supported by NASA grant NNH16CT05C.
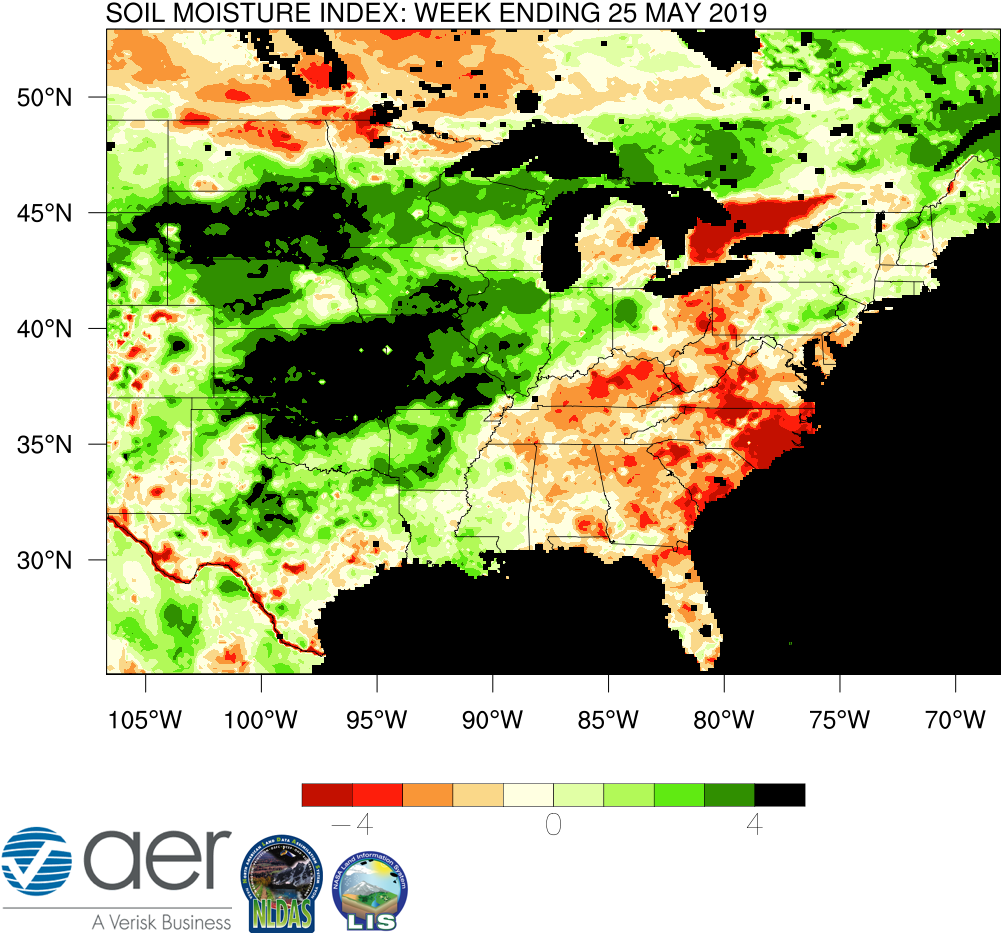
Figure 1. The Soil Moisture Index (SMI) for the 7-day period ending 25 May 2019. Results are based on output from the 0-1 m (surface to 3.23 feet) layers in the Noah-Multiparameterization (Noah-MP) land surface model. Noah-MP is run in the NASA Land Information System (LIS) framework with the North American Land Data Assimilation Version 2 (NLDAS-2) forcing dataset. The SMI calculation is based on the soil moisture index created in Hunt et al. (2009) such that ‘5’(dark green) is the wettest and ‘-5’ (dark red) the driest for the period of record. The period of record used calculate the SMI for the current map is 1979-present.

Figure 2. Comparison of this week’s SMI map the last three week’s SMI maps.
Narrative:
Figures 1 and 2 help confirm that it has been a historically wet May for much of the central U.S. and an awful season thus far for many farmers in the Corn Belt. According to the most recent Crop Progress Report, 58 percent of corn and 29 percent of soybean have been planted. Both are well behind historical averages and it is easily the lowest amount of corn planted at the end of May in the 40 years (Fig 3.) For soybean, only 1990 had a lower percentage planted at this point in the season (Week 21).
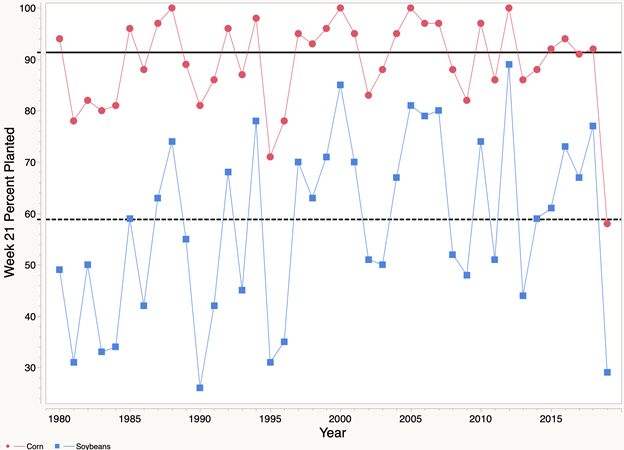
Figure 3. Percent of corn and soybeans planted by the end of Week 21 from 1980-2019. The solid (dashed) line represents the 40-year median for corn(soybean). Data from USDA NASS.
According to the U.S. Drought Monitor, we are still at near record low for the amount of drought, with less than 5 percent of the continental U.S. in drought. This number is up slightly over the last few weeks, though still very low by historical standards. The southeastern United States is worth watching for flash drought development in June though as the intense ridge over that region has led to significant drying, with most of the region now having negative SMI values. A pocket of negative SMI values still exists in northern North Dakota and northwest Minnesota, though this hasn’t gotten much worse over the past few weeks. Everywhere else has adequate moisture or in most cases, excessive amounts at this time.